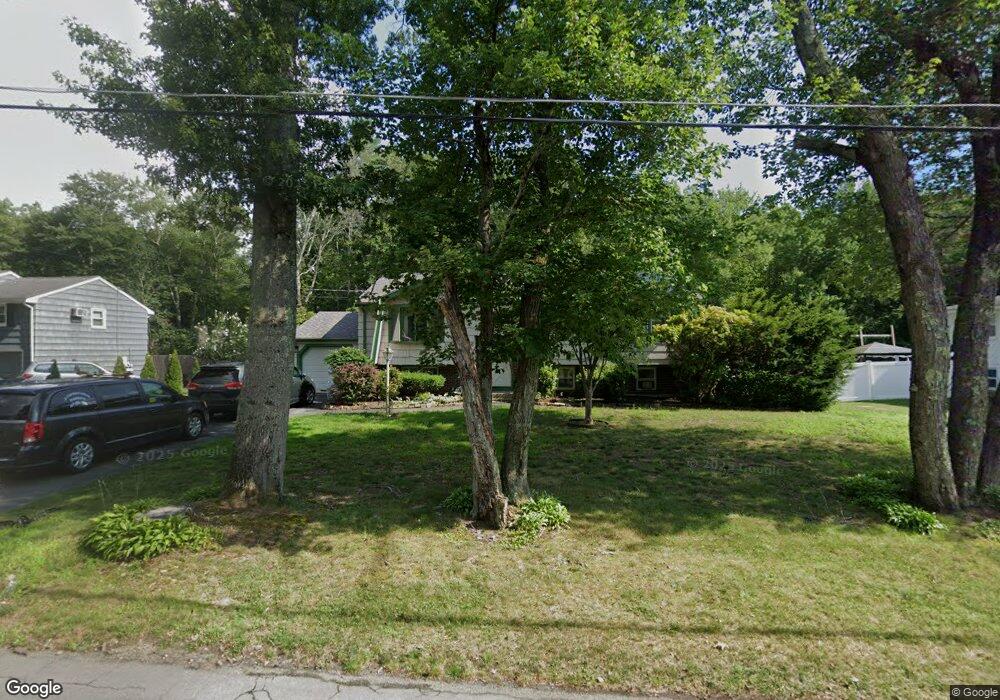
96 Shirley Rd Stoughton, MA 02072
Estimated Value: $701,000 - $716,386
3
Beds
3
Baths
1,990
Sq Ft
$357/Sq Ft
Est. Value
About This Home
This home is located at 96 Shirley Rd, Stoughton, MA 02072 and is currently estimated at $710,847, approximately $357 per square foot. 96 Shirley Rd is a home located in Norfolk County with nearby schools including South Elementary School, Dr. Robert G. O'Donnell Middle School, and Stoughton High School.
Ownership History
Date
Name
Owned For
Owner Type
Purchase Details
Closed on
Jul 18, 2025
Sold by
Similien Jean M and Similien Marie M
Bought by
Similien Andy and Similien Jeffrey
Current Estimated Value
Home Financials for this Owner
Home Financials are based on the most recent Mortgage that was taken out on this home.
Original Mortgage
$544,362
Outstanding Balance
$542,508
Interest Rate
6.85%
Mortgage Type
FHA
Estimated Equity
$168,339
Purchase Details
Closed on
Oct 29, 2004
Sold by
Similien Jean M
Bought by
Similien Jean M and Similien Marie M
Home Financials for this Owner
Home Financials are based on the most recent Mortgage that was taken out on this home.
Original Mortgage
$245,000
Interest Rate
5.74%
Mortgage Type
Purchase Money Mortgage
Purchase Details
Closed on
Jul 8, 1992
Sold by
Akoghlanian Levon and Akoghlanian Kara M
Bought by
Edwards Glenn D and Edwards Ana M
Create a Home Valuation Report for This Property
The Home Valuation Report is an in-depth analysis detailing your home's value as well as a comparison with similar homes in the area
Home Values in the Area
Average Home Value in this Area
Purchase History
| Date | Buyer | Sale Price | Title Company |
|---|---|---|---|
| Similien Andy | $700,000 | -- | |
| Similien Andy | $700,000 | -- | |
| Similien Jean M | $435,000 | -- | |
| Similien Jean M | $435,000 | -- | |
| Similien Jean M | $435,000 | -- | |
| Similien Jean M | $435,000 | -- | |
| Edwards Glenn D | $149,000 | -- | |
| Similien Jean M | $435,000 | -- | |
| Edwards Glenn D | $149,000 | -- |
Source: Public Records
Mortgage History
| Date | Status | Borrower | Loan Amount |
|---|---|---|---|
| Open | Similien Andy | $544,362 | |
| Closed | Similien Andy | $544,362 | |
| Previous Owner | Similien Jean M | $245,000 |
Source: Public Records
Tax History Compared to Growth
Tax History
| Year | Tax Paid | Tax Assessment Tax Assessment Total Assessment is a certain percentage of the fair market value that is determined by local assessors to be the total taxable value of land and additions on the property. | Land | Improvement |
|---|---|---|---|---|
| 2025 | $7,095 | $573,100 | $239,000 | $334,100 |
| 2024 | $6,897 | $541,800 | $218,300 | $323,500 |
| 2023 | $6,660 | $491,500 | $199,500 | $292,000 |
| 2022 | $6,510 | $451,800 | $192,000 | $259,800 |
| 2021 | $6,070 | $402,000 | $169,400 | $232,600 |
| 2020 | $5,856 | $393,300 | $169,400 | $223,900 |
| 2019 | $5,891 | $384,000 | $169,400 | $214,600 |
| 2018 | $5,240 | $353,800 | $161,800 | $192,000 |
| 2017 | $5,025 | $346,800 | $160,000 | $186,800 |
| 2016 | $4,853 | $324,200 | $144,900 | $179,300 |
| 2015 | $4,792 | $316,700 | $137,400 | $179,300 |
| 2014 | $4,668 | $296,600 | $126,100 | $170,500 |
Source: Public Records
Map
Nearby Homes