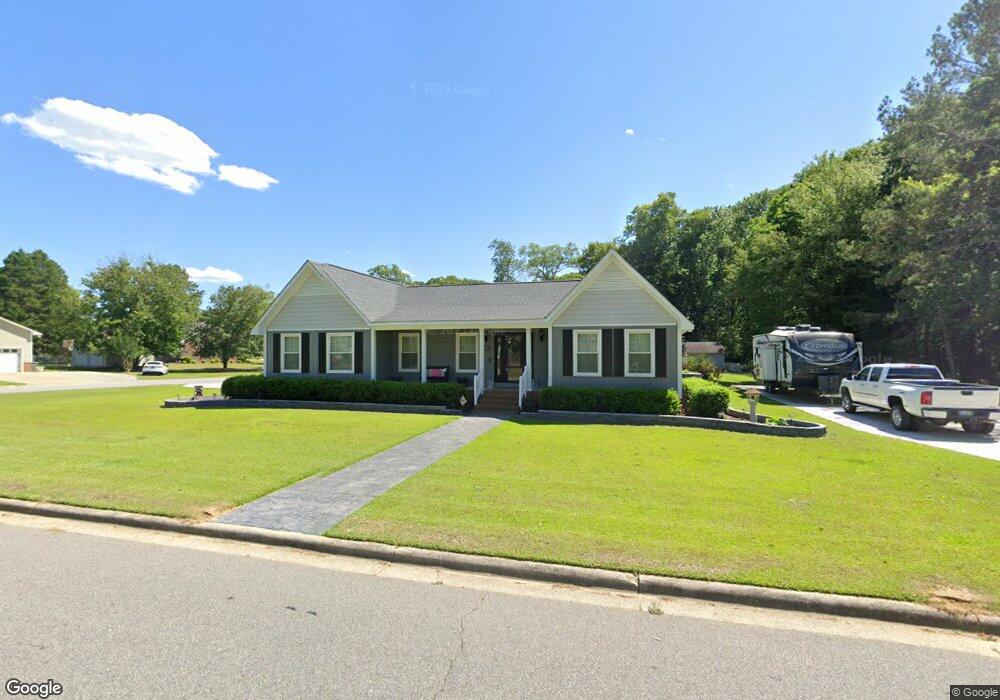
96 Tartan Rd Lumberton, NC 28358
Estimated Value: $280,000 - $345,000
4
Beds
2
Baths
2,098
Sq Ft
$142/Sq Ft
Est. Value
About This Home
This home is located at 96 Tartan Rd, Lumberton, NC 28358 and is currently estimated at $298,486, approximately $142 per square foot. 96 Tartan Rd is a home located in Robeson County with nearby schools including Tanglewood Elementary School, Parkton Elementary School, and L. Gilbert Carroll Middle School.
Ownership History
Date
Name
Owned For
Owner Type
Purchase Details
Closed on
Feb 26, 2019
Sold by
Hayes Susan Y
Bought by
Thorndyke Luke Michael
Current Estimated Value
Purchase Details
Closed on
May 22, 2013
Sold by
Davis Everett and Davis Ann B
Bought by
Hayes Susan Y and Hayes Michael A
Home Financials for this Owner
Home Financials are based on the most recent Mortgage that was taken out on this home.
Original Mortgage
$146,800
Interest Rate
3.44%
Mortgage Type
New Conventional
Create a Home Valuation Report for This Property
The Home Valuation Report is an in-depth analysis detailing your home's value as well as a comparison with similar homes in the area
Home Values in the Area
Average Home Value in this Area
Purchase History
| Date | Buyer | Sale Price | Title Company |
|---|---|---|---|
| Thorndyke Luke Michael | $30,000 | None Available | |
| Hayes Susan Y | $183,500 | None Available |
Source: Public Records
Mortgage History
| Date | Status | Borrower | Loan Amount |
|---|---|---|---|
| Previous Owner | Hayes Susan Y | $146,800 |
Source: Public Records
Tax History Compared to Growth
Tax History
| Year | Tax Paid | Tax Assessment Tax Assessment Total Assessment is a certain percentage of the fair market value that is determined by local assessors to be the total taxable value of land and additions on the property. | Land | Improvement |
|---|---|---|---|---|
| 2025 | $1,792 | $228,300 | $27,500 | $200,800 |
| 2024 | $1,787 | $228,300 | $27,500 | $200,800 |
| 2023 | $1,365 | $171,200 | $25,000 | $146,200 |
| 2022 | $1,365 | $171,200 | $25,000 | $146,200 |
| 2021 | $812 | $105,400 | $25,000 | $80,400 |
| 2020 | $795 | $105,400 | $25,000 | $80,400 |
| 2018 | $1,461 | $115,800 | $30,000 | $85,800 |
| 2017 | $953 | $186,100 | $30,000 | $156,100 |
| 2016 | $1,495 | $186,100 | $30,000 | $156,100 |
| 2015 | $1,495 | $186,100 | $30,000 | $156,100 |
| 2014 | $1,495 | $186,100 | $30,000 | $156,100 |
Source: Public Records
Map
Nearby Homes