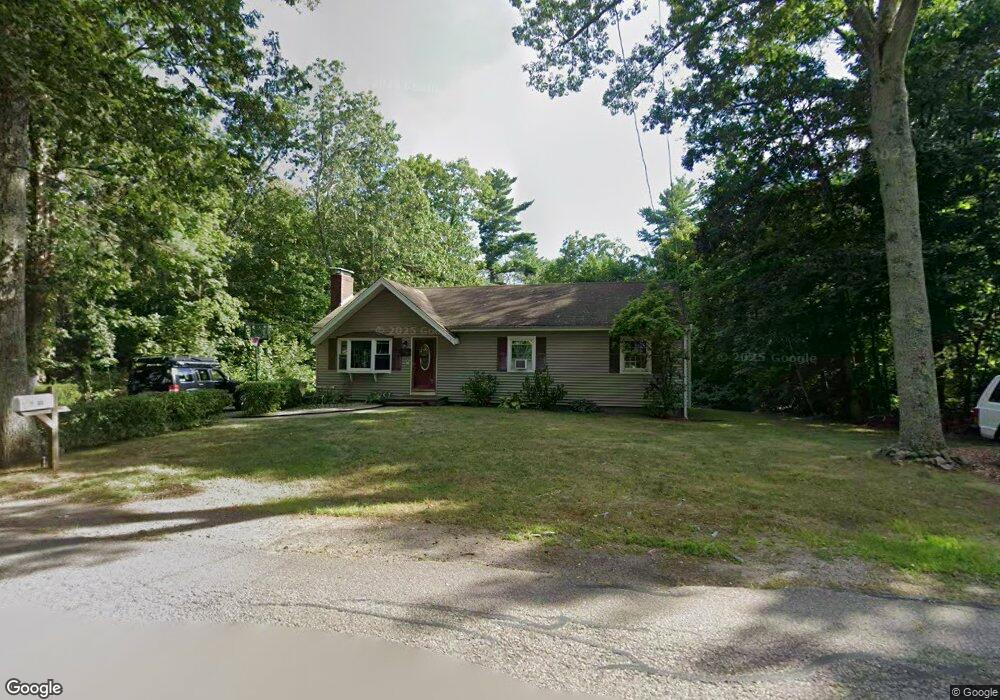
96 Wampum St Wrentham, MA 02093
Estimated Value: $568,000 - $703,000
3
Beds
2
Baths
1,196
Sq Ft
$511/Sq Ft
Est. Value
About This Home
This home is located at 96 Wampum St, Wrentham, MA 02093 and is currently estimated at $611,547, approximately $511 per square foot. 96 Wampum St is a home located in Norfolk County with nearby schools including Delaney Elementary School and Charles E Roderick.
Ownership History
Date
Name
Owned For
Owner Type
Purchase Details
Closed on
May 4, 2006
Sold by
Ferland Edward J and Impey Patricia A
Bought by
Ferland Edward J
Current Estimated Value
Purchase Details
Closed on
Dec 19, 1996
Sold by
Ferland Edward N and Ferland Nancy W
Bought by
Ferland Edward J
Home Financials for this Owner
Home Financials are based on the most recent Mortgage that was taken out on this home.
Original Mortgage
$132,000
Interest Rate
7.62%
Mortgage Type
Purchase Money Mortgage
Create a Home Valuation Report for This Property
The Home Valuation Report is an in-depth analysis detailing your home's value as well as a comparison with similar homes in the area
Home Values in the Area
Average Home Value in this Area
Purchase History
| Date | Buyer | Sale Price | Title Company |
|---|---|---|---|
| Ferland Edward J | -- | -- | |
| Ferland Edward J | $165,000 | -- |
Source: Public Records
Mortgage History
| Date | Status | Borrower | Loan Amount |
|---|---|---|---|
| Previous Owner | Ferland Edward J | $125,325 | |
| Previous Owner | Ferland Edward J | $75,000 | |
| Previous Owner | Ferland Edward J | $132,000 | |
| Previous Owner | Ferland Edward J | $114,000 |
Source: Public Records
Tax History Compared to Growth
Tax History
| Year | Tax Paid | Tax Assessment Tax Assessment Total Assessment is a certain percentage of the fair market value that is determined by local assessors to be the total taxable value of land and additions on the property. | Land | Improvement |
|---|---|---|---|---|
| 2025 | $5,571 | $480,700 | $258,100 | $222,600 |
| 2024 | $5,180 | $431,700 | $258,100 | $173,600 |
| 2023 | $5,324 | $421,900 | $262,900 | $159,000 |
| 2022 | $4,864 | $355,800 | $209,000 | $146,800 |
| 2021 | $143 | $317,100 | $177,000 | $140,100 |
| 2020 | $4,047 | $284,000 | $146,600 | $137,400 |
| 2019 | $3,979 | $281,800 | $146,600 | $135,200 |
| 2018 | $4,066 | $285,500 | $146,700 | $138,800 |
| 2017 | $3,826 | $268,500 | $143,900 | $124,600 |
| 2016 | $3,763 | $263,500 | $139,700 | $123,800 |
| 2015 | $3,583 | $239,200 | $134,300 | $104,900 |
| 2014 | $3,526 | $230,300 | $129,200 | $101,100 |
Source: Public Records
Map
Nearby Homes
- 1204 South St
- 1222 South St
- 4 Munroe Dr
- 12 Grant St
- 791 South St Unit 5
- 387 South St
- 160 Washington St Unit 36
- 44 Maple Terrace Unit 44
- 158 Washington St
- 80 Willow Ln
- 126 Washington St
- 130 Washington St
- 124 Washington St
- 19 Chestnut Lot 0
- 50 Green St
- 29 Broad St
- 319 Taunton St
- Lot 1 - Blueberry 2 Car Plan at King Philip Estates
- Lot 8 - Blueberry 2 Car Plan at King Philip Estates
- Lot 5 - Hughes 2 car Plan at King Philip Estates