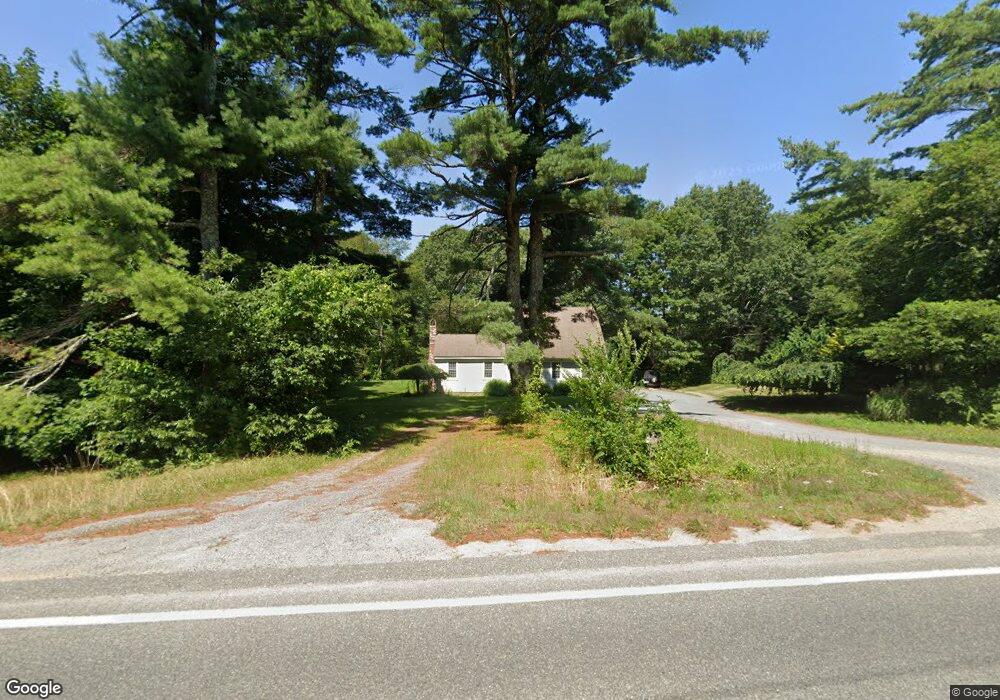
96 Wenham Rd Carver, MA 02330
Estimated Value: $601,000 - $655,000
2
Beds
3
Baths
1,452
Sq Ft
$432/Sq Ft
Est. Value
About This Home
This home is located at 96 Wenham Rd, Carver, MA 02330 and is currently estimated at $626,625, approximately $431 per square foot. 96 Wenham Rd is a home located in Plymouth County with nearby schools including Carver Elementary School, Rising Tide Charter Public School, and Map Academy Charter School.
Ownership History
Date
Name
Owned For
Owner Type
Purchase Details
Closed on
Sep 25, 2019
Sold by
Madden Taryn C
Bought by
Madden Taryn C and Malonson Joshua
Current Estimated Value
Home Financials for this Owner
Home Financials are based on the most recent Mortgage that was taken out on this home.
Original Mortgage
$35,000
Outstanding Balance
$30,526
Interest Rate
3.5%
Mortgage Type
New Conventional
Estimated Equity
$596,099
Purchase Details
Closed on
Sep 25, 2006
Sold by
Madden Richard E and Madden Susan J
Bought by
Madden Taryn C
Home Financials for this Owner
Home Financials are based on the most recent Mortgage that was taken out on this home.
Original Mortgage
$250,000
Interest Rate
6.39%
Create a Home Valuation Report for This Property
The Home Valuation Report is an in-depth analysis detailing your home's value as well as a comparison with similar homes in the area
Home Values in the Area
Average Home Value in this Area
Purchase History
| Date | Buyer | Sale Price | Title Company |
|---|---|---|---|
| Madden Taryn C | -- | -- | |
| Madden Taryn C | -- | -- |
Source: Public Records
Mortgage History
| Date | Status | Borrower | Loan Amount |
|---|---|---|---|
| Open | Madden Taryn C | $35,000 | |
| Previous Owner | Madden Taryn C | $250,000 |
Source: Public Records
Tax History Compared to Growth
Tax History
| Year | Tax Paid | Tax Assessment Tax Assessment Total Assessment is a certain percentage of the fair market value that is determined by local assessors to be the total taxable value of land and additions on the property. | Land | Improvement |
|---|---|---|---|---|
| 2025 | $7,617 | $549,200 | $135,000 | $414,200 |
| 2024 | $7,160 | $505,300 | $132,300 | $373,000 |
| 2023 | $6,935 | $475,300 | $132,300 | $343,000 |
| 2022 | $6,565 | $410,800 | $113,100 | $297,700 |
| 2021 | $6,513 | $384,500 | $101,000 | $283,500 |
| 2020 | $6,214 | $361,500 | $94,400 | $267,100 |
| 2019 | $6,046 | $354,600 | $91,700 | $262,900 |
| 2018 | $5,661 | $321,100 | $91,700 | $229,400 |
| 2017 | $5,378 | $304,000 | $83,500 | $220,500 |
| 2016 | $4,995 | $293,300 | $79,600 | $213,700 |
| 2015 | $4,807 | $282,600 | $79,600 | $203,000 |
| 2014 | $4,727 | $277,900 | $106,200 | $171,700 |
Source: Public Records
Map
Nearby Homes