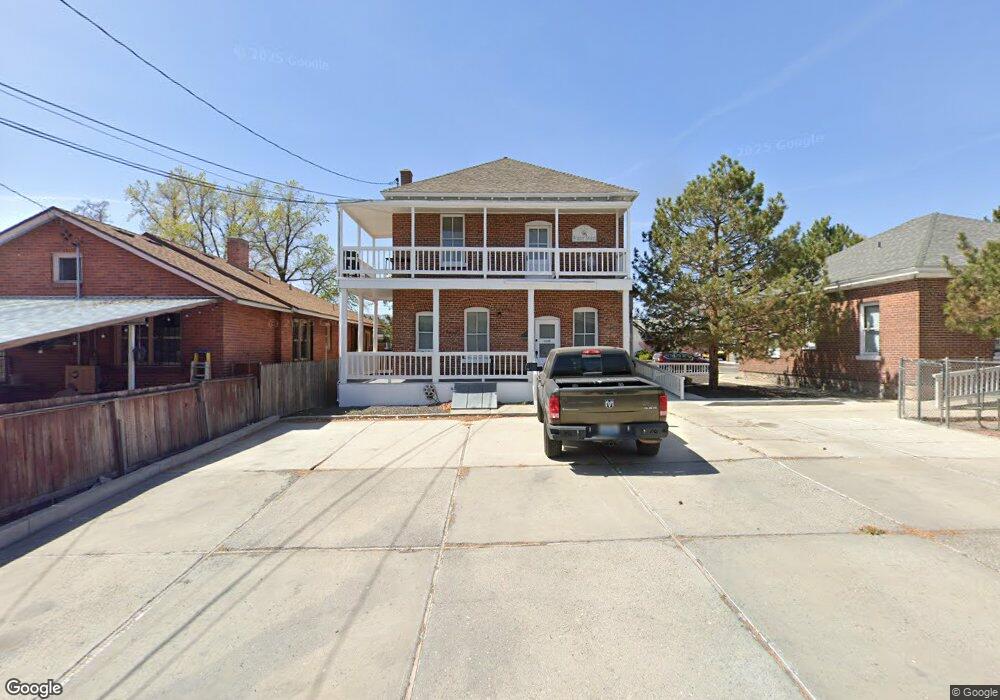
96 Winter St Reno, NV 89503
Riverwalk NeighborhoodEstimated Value: $808,291
7
Beds
1
Bath
1,792
Sq Ft
$451/Sq Ft
Est. Value
About This Home
This home is located at 96 Winter St, Reno, NV 89503 and is currently estimated at $808,291, approximately $451 per square foot. 96 Winter St is a home located in Washoe County with nearby schools including Hunter Lake Elementary School, Darrell C Swope Middle School, and Reno High School.
Ownership History
Date
Name
Owned For
Owner Type
Purchase Details
Closed on
Jan 13, 2021
Sold by
Hardy Del and The Hardy Trust
Bought by
A M Engineering Llc
Current Estimated Value
Home Financials for this Owner
Home Financials are based on the most recent Mortgage that was taken out on this home.
Original Mortgage
$492,000
Outstanding Balance
$439,112
Interest Rate
2.71%
Mortgage Type
Commercial
Estimated Equity
$369,179
Purchase Details
Closed on
Sep 1, 2015
Sold by
Hardy Del
Bought by
Hardy Del and The Hardy Trust
Purchase Details
Closed on
Feb 15, 2001
Sold by
Fields Rodney A and Fields Idella S
Bought by
Fields Rodney A and Fields Idella S
Purchase Details
Closed on
Nov 1, 1998
Sold by
Fujiwara Hirosuke and Fujiwara Takako
Bought by
Hardy Del
Purchase Details
Closed on
Jun 23, 1994
Sold by
Cal Western Reconveyance Corp
Bought by
Hardy Del
Create a Home Valuation Report for This Property
The Home Valuation Report is an in-depth analysis detailing your home's value as well as a comparison with similar homes in the area
Home Values in the Area
Average Home Value in this Area
Purchase History
| Date | Buyer | Sale Price | Title Company |
|---|---|---|---|
| A M Engineering Llc | $615,000 | First American Title Reno | |
| Hardy Del | -- | None Available | |
| Fields Rodney A | -- | -- | |
| Hardy Del | $179,500 | United Title | |
| Hardy Del | $166,500 | First American Title Company |
Source: Public Records
Mortgage History
| Date | Status | Borrower | Loan Amount |
|---|---|---|---|
| Open | A M Engineering Llc | $492,000 |
Source: Public Records
Tax History Compared to Growth
Tax History
| Year | Tax Paid | Tax Assessment Tax Assessment Total Assessment is a certain percentage of the fair market value that is determined by local assessors to be the total taxable value of land and additions on the property. | Land | Improvement |
|---|---|---|---|---|
| 2025 | $1,707 | $69,800 | $44,306 | $25,494 |
| 2024 | $1,707 | $67,507 | $42,144 | $25,363 |
| 2023 | $1,582 | $63,368 | $39,983 | $23,385 |
| 2022 | $1,470 | $50,460 | $30,798 | $19,662 |
| 2021 | $1,357 | $36,763 | $18,288 | $18,475 |
| 2020 | $1,277 | $36,719 | $18,288 | $18,431 |
| 2019 | $1,217 | $34,015 | $16,625 | $17,390 |
| 2018 | $1,165 | $31,440 | $14,963 | $16,477 |
| 2017 | $1,137 | $31,304 | $14,963 | $16,341 |
| 2016 | $1,109 | $30,227 | $14,131 | $16,096 |
| 2015 | $1,108 | $29,916 | $14,131 | $15,785 |
| 2014 | $1,074 | $29,052 | $14,131 | $14,921 |
| 2013 | -- | $28,624 | $14,131 | $14,493 |
Source: Public Records
Map
Nearby Homes
- 631 California Ave
- 745 California Ave
- 619 Marsh Ave
- 1200 Riverside Dr Unit 1271
- 1200 Riverside Dr Unit 1276
- 100 N Arlington Ave Unit 22G
- 100 N Arlington Ave Unit 21K
- 100 N Arlington Ave Unit 7B
- 100 N Arlington Ave Unit 10E
- 100 N Arlington Ave Unit 6G
- 100 N Arlington Ave Unit 20J
- 100 N Arlington Ave Unit 22C
- 100 N Arlington Ave Unit 7K
- 100 N Arlington Ave Unit 20E
- 100 N Arlington Ave Unit 22-H
- 100 N Arlington Ave Unit 17G
- 100 N Arlington Ave Unit 23-M
- 100 N Arlington Ave Unit 23P
- 100 N Arlington Ave Unit 6E
- 280 Island Ave Unit 1602