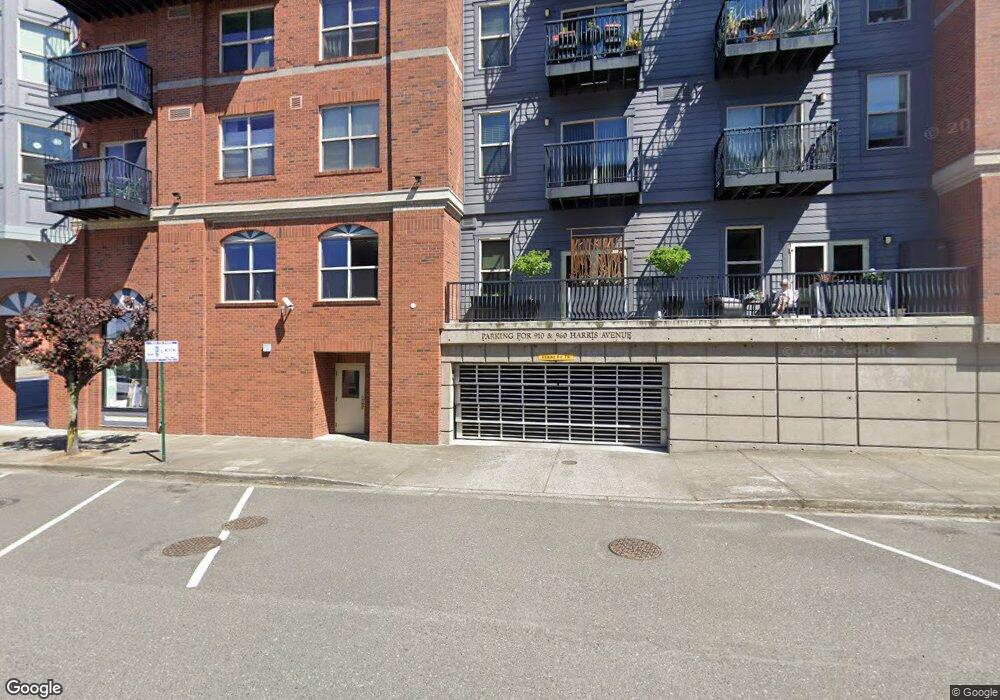
960 Harris Ave Unit B-201 Bellingham, WA 98225
Fairhaven NeighborhoodEstimated Value: $1,499,534
--
Bed
--
Bath
3,146
Sq Ft
$477/Sq Ft
Est. Value
About This Home
This home is located at 960 Harris Ave Unit B-201, Bellingham, WA 98225 and is currently estimated at $1,499,534, approximately $476 per square foot. 960 Harris Ave Unit B-201 is a home located in Whatcom County with nearby schools including Lowell Elementary School, Fairhaven Middle School, and Sehome High School.
Ownership History
Date
Name
Owned For
Owner Type
Purchase Details
Closed on
Mar 17, 2015
Sold by
Tillman Mcadoo Lidia C
Bought by
The Vander Ploeg Living Trust and Vander Ploeg Karla Patricia
Current Estimated Value
Purchase Details
Closed on
Dec 6, 2013
Sold by
Mcadoo William M
Bought by
Tillman Mc Adoo Lidia
Purchase Details
Closed on
Jun 5, 2008
Sold by
Muljat Troy C and Muljat Heather M
Bought by
Mcadoo William G and Tillman Mcadoo Lidia C
Home Financials for this Owner
Home Financials are based on the most recent Mortgage that was taken out on this home.
Original Mortgage
$528,750
Interest Rate
6.05%
Mortgage Type
Commercial
Purchase Details
Closed on
Sep 19, 2005
Sold by
10Th & Harris Block Lp
Bought by
Muljat Troy C and Muljat Heather M
Home Financials for this Owner
Home Financials are based on the most recent Mortgage that was taken out on this home.
Original Mortgage
$834,500
Interest Rate
5.81%
Mortgage Type
Commercial
Create a Home Valuation Report for This Property
The Home Valuation Report is an in-depth analysis detailing your home's value as well as a comparison with similar homes in the area
Home Values in the Area
Average Home Value in this Area
Purchase History
| Date | Buyer | Sale Price | Title Company |
|---|---|---|---|
| The Vander Ploeg Living Trust | $615,000 | Whatcom Land Title | |
| Tillman Mc Adoo Lidia | -- | None Available | |
| Mcadoo William G | $705,280 | Whatcom Land Title | |
| Muljat Troy C | $682,780 | First American Title Insuran |
Source: Public Records
Mortgage History
| Date | Status | Borrower | Loan Amount |
|---|---|---|---|
| Previous Owner | Mcadoo William G | $528,750 | |
| Previous Owner | Muljat Troy C | $834,500 |
Source: Public Records
Tax History Compared to Growth
Tax History
| Year | Tax Paid | Tax Assessment Tax Assessment Total Assessment is a certain percentage of the fair market value that is determined by local assessors to be the total taxable value of land and additions on the property. | Land | Improvement |
|---|---|---|---|---|
| 2024 | $4,724 | $667,640 | $99,825 | $567,815 |
| 2023 | $4,724 | $606,946 | $90,750 | $516,196 |
| 2022 | $4,682 | $606,946 | $90,750 | $516,196 |
| 2021 | $5,071 | $501,608 | $75,000 | $426,608 |
| 2020 | $5,250 | $501,608 | $75,000 | $426,608 |
| 2019 | $7,063 | $501,608 | $75,000 | $426,608 |
| 2018 | $7,704 | $676,762 | $41,829 | $634,933 |
| 2017 | $6,786 | $633,667 | $39,165 | $594,502 |
| 2016 | $6,514 | $582,702 | $36,015 | $546,687 |
| 2015 | $6,543 | $582,702 | $36,015 | $546,687 |
| 2014 | -- | $566,280 | $35,000 | $531,280 |
| 2013 | -- | $566,280 | $35,000 | $531,280 |
Source: Public Records
Map
Nearby Homes
- 910 Harris Ave Unit 304
- 910 Harris Ave Unit 208
- 707 Donovan Ave
- 1302 Larrabee Ave
- 1315 Mill Ave
- 1212 Old Fairhaven Pkwy Unit D202
- 1014 11th St Unit 302
- 917 13th St
- 1131 16th St
- 1605 Donovan Ave
- 1005 15th St
- 903 13th St
- 214 Bayside Rd
- 805 11th St
- 1012 17th St
- 700 11th St Unit C4
- 600 S State St Unit 208
- 600 S State St Unit 212
- 600 S State St Unit 101
- 600 S State St Unit 204
- 960 Harris Ave
- 960 Harris Ave Unit B104
- 960 Harris Ave Unit B103
- 960 Harris Ave Unit 101
- 960 Harris Ave Unit 604
- 960 Harris Ave Unit 502
- 960 Harris Ave Unit 605
- 960 Harris Ave Unit 603
- 960 Harris Ave Unit 602
- 960 Harris Ave Unit 601
- 960 Harris Ave Unit 505
- 960 Harris Ave Unit 504
- 960 Harris Ave Unit 503
- 960 Harris Ave Unit 501
- 960 Harris Ave Unit 408
- 960 Harris Ave Unit 407
- 960 Harris Ave Unit 406
- 960 Harris Ave Unit 405
- 960 Harris Ave Unit 404
- 960 Harris Ave Unit 403