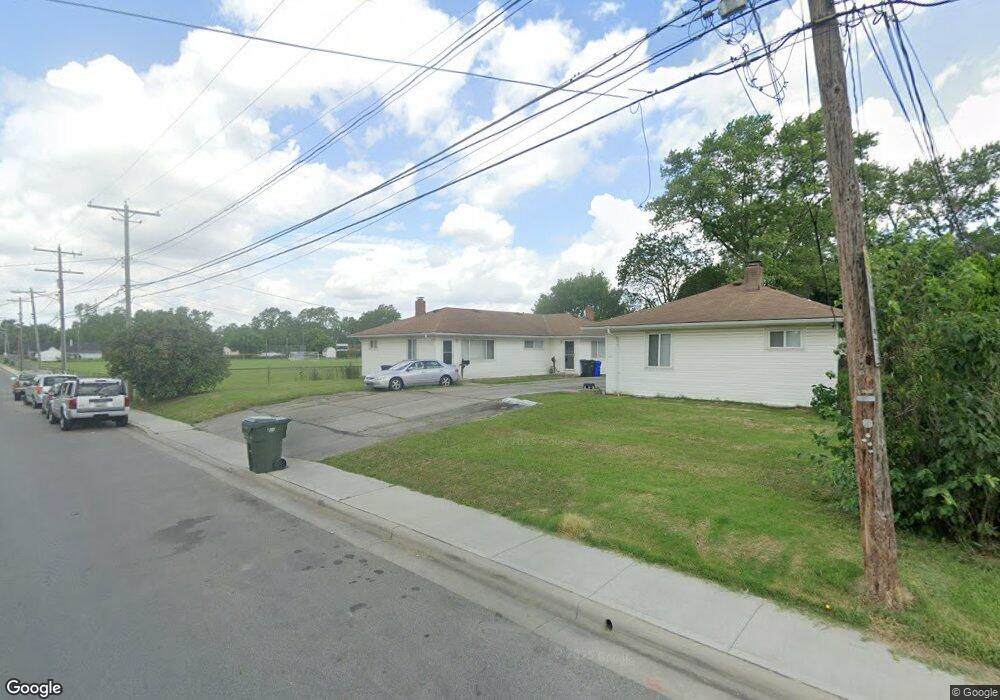
960 Moon Rd Unit 962 Columbus, OH 43224
North Linden NeighborhoodEstimated Value: $224,000 - $239,000
4
Beds
2
Baths
1,617
Sq Ft
$143/Sq Ft
Est. Value
About This Home
This home is located at 960 Moon Rd Unit 962, Columbus, OH 43224 and is currently estimated at $231,319, approximately $143 per square foot. 960 Moon Rd Unit 962 is a home located in Franklin County with nearby schools including Maize Road Elementary School, Medina Middle School, and Mifflin High School.
Ownership History
Date
Name
Owned For
Owner Type
Purchase Details
Closed on
Aug 9, 2022
Sold by
Sexton Brian J and Sexton Amy
Bought by
Jean-Louis Naulac
Current Estimated Value
Home Financials for this Owner
Home Financials are based on the most recent Mortgage that was taken out on this home.
Original Mortgage
$155,120
Outstanding Balance
$147,494
Interest Rate
5.51%
Mortgage Type
New Conventional
Estimated Equity
$83,825
Purchase Details
Closed on
Aug 15, 1997
Sold by
Sexton Brian J and Sexton Amy
Bought by
Hinton Patrick J and Hinton Maria C
Home Financials for this Owner
Home Financials are based on the most recent Mortgage that was taken out on this home.
Original Mortgage
$127,500
Interest Rate
8.62%
Purchase Details
Closed on
Aug 31, 1995
Sold by
Culp Cheryl M
Bought by
Brian J Sexton and Amy
Home Financials for this Owner
Home Financials are based on the most recent Mortgage that was taken out on this home.
Original Mortgage
$81,600
Interest Rate
7.55%
Mortgage Type
New Conventional
Purchase Details
Closed on
Feb 21, 1992
Create a Home Valuation Report for This Property
The Home Valuation Report is an in-depth analysis detailing your home's value as well as a comparison with similar homes in the area
Home Values in the Area
Average Home Value in this Area
Purchase History
| Date | Buyer | Sale Price | Title Company |
|---|---|---|---|
| Jean-Louis Naulac | $194,000 | Chicago Title | |
| Hinton Patrick J | -- | Transohio Title | |
| Brian J Sexton | $102,000 | -- | |
| -- | -- | -- |
Source: Public Records
Mortgage History
| Date | Status | Borrower | Loan Amount |
|---|---|---|---|
| Open | Jean-Louis Naulac | $155,120 | |
| Previous Owner | Hinton Patrick J | $127,500 | |
| Previous Owner | Brian J Sexton | $81,600 |
Source: Public Records
Tax History
| Year | Tax Paid | Tax Assessment Tax Assessment Total Assessment is a certain percentage of the fair market value that is determined by local assessors to be the total taxable value of land and additions on the property. | Land | Improvement |
|---|---|---|---|---|
| 2025 | $3,189 | $69,580 | $16,030 | $53,550 |
| 2024 | $3,189 | $69,580 | $16,030 | $53,550 |
| 2023 | $3,299 | $69,580 | $16,030 | $53,550 |
| 2022 | $2,203 | $41,450 | $5,780 | $35,670 |
| 2021 | $2,207 | $41,450 | $5,780 | $35,670 |
| 2020 | $2,210 | $41,450 | $5,780 | $35,670 |
| 2019 | $2,061 | $33,150 | $4,620 | $28,530 |
| 2018 | $2,115 | $33,150 | $4,620 | $28,530 |
| 2017 | $2,061 | $33,150 | $4,620 | $28,530 |
| 2016 | $2,385 | $35,110 | $5,010 | $30,100 |
| 2015 | $2,172 | $35,110 | $5,010 | $30,100 |
| 2014 | $2,177 | $35,110 | $5,010 | $30,100 |
| 2013 | $1,131 | $36,960 | $5,285 | $31,675 |
Source: Public Records
Map
Nearby Homes
- 991 Hidden Acres Ct Unit 991
- 3546 Beulah Rd
- 1242 Acton Rd
- 1120 Piedmont Rd
- 796 E Kenworth Rd
- 3268 McGuffey Rd
- 544 Piedmont Rd
- 3352 Karl Rd
- 3620 Walmar Dr
- 3401 Walmar Dr
- 3585 Gerbert Rd
- 3147 Grasmere Ave
- 3491 Ontario St
- 3941 Karl Rd Unit 326
- 3471 Ontario St
- 914 Weldon Ave
- 467 Brevoort Rd
- 1303 Oakland Park Ave
- 3939 Karl Rd Unit 311
- 3967 Karl Rd Unit 224
- 960-962 Moon Rd
- 966-968 Moon Rd
- 966 Moon Rd Unit 968
- 970 Moon Rd Unit 972
- 963 Moon Rd
- 951 Moon Rd Unit 953
- 973 Moon Rd
- 973 Moon Rd Unit A,B,C
- 945 Moon Rd Unit 947
- 3633 Maize Rd
- 3639 Maize Rd
- 939 Moon Rd
- 3645 Maize Rd
- 3623 Maize Rd
- 3653 Maize Rd
- 3613 Maize Rd
- 931 Moon Rd Unit 935
- 931-935 Moon Rd
- 3655 Maize Rd
- 3609 Maize Rd
Your Personal Tour Guide
Ask me questions while you tour the home.