960 N Eugenia Place NW Unit 22 Atlanta, GA 30318
Grove Park NeighborhoodEstimated Value: $162,000 - $231,000
2
Beds
2
Baths
960
Sq Ft
$192/Sq Ft
Est. Value
About This Home
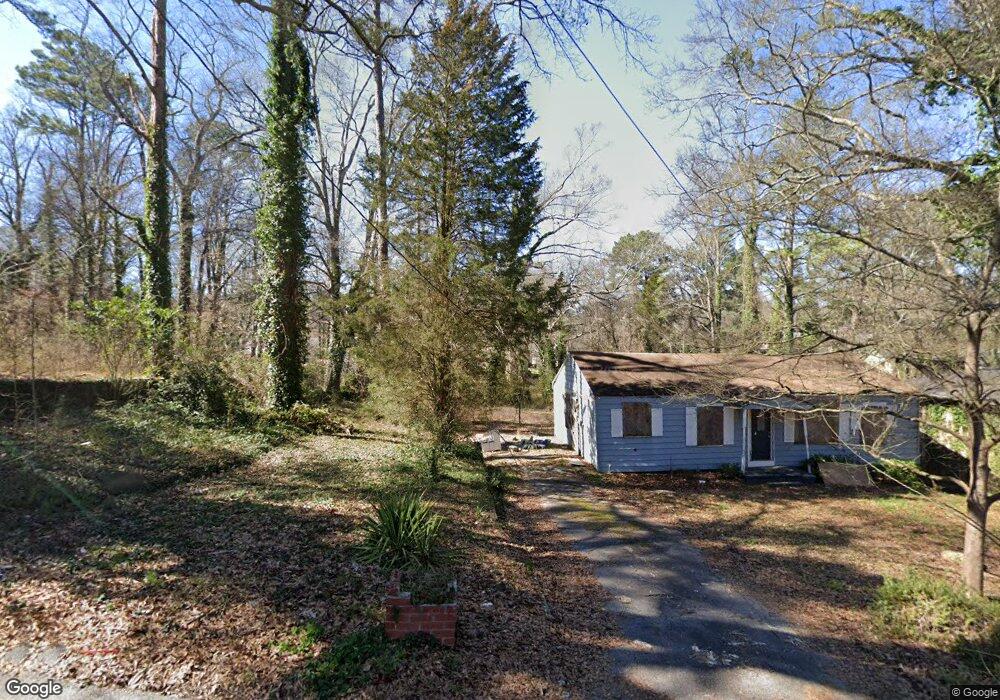
This home is located at 960 N Eugenia Place NW Unit 22, Atlanta, GA 30318 and is currently estimated at $183,864, approximately $191 per square foot. 960 N Eugenia Place NW Unit 22 is a home located in Fulton County with nearby schools including Frederick Douglass High School, KIPP Atlanta Collegiate, and Bright Futures Academy.
Ownership History
Date
Name
Owned For
Owner Type
Purchase Details
Closed on
Apr 15, 2024
Sold by
Russell Casey
Bought by
Acros Capital Inc
Current Estimated Value
Purchase Details
Closed on
Oct 2, 2020
Sold by
Barks Design Llc
Bought by
Russell Casey and Thorner Jerome Mitchell
Purchase Details
Closed on
Aug 5, 2019
Sold by
Jordan Elgin
Bought by
Barks Design Llc
Purchase Details
Closed on
Jan 18, 2012
Sold by
Jackman Cheryl
Bought by
Jordan Elgin and Ridley Susan
Purchase Details
Closed on
Apr 22, 2009
Sold by
Wells Fargo B Trust 2006 & Fr3
Bought by
Jackman Cheryl
Purchase Details
Closed on
Mar 3, 2009
Sold by
Burton Clinet C
Bought by
Securitized Receiv Trust 2006 &
Purchase Details
Closed on
Jul 13, 2005
Sold by
Riggins Harvey L
Bought by
Burton Clinet C
Home Financials for this Owner
Home Financials are based on the most recent Mortgage that was taken out on this home.
Original Mortgage
$92,000
Interest Rate
5.59%
Mortgage Type
New Conventional
Create a Home Valuation Report for This Property
The Home Valuation Report is an in-depth analysis detailing your home's value as well as a comparison with similar homes in the area
Home Values in the Area
Average Home Value in this Area
Purchase History
| Date | Buyer | Sale Price | Title Company |
|---|---|---|---|
| Acros Capital Inc | $190,000 | -- | |
| Russell Casey | $105,000 | -- | |
| Barks Design Llc | $55,000 | -- | |
| Jordan Elgin | $11,000 | -- | |
| Jackman Cheryl | $8,900 | -- | |
| Securitized Receiv Trust 2006 & | $16,120 | -- | |
| Burton Clinet C | $65,000 | -- |
Source: Public Records
Mortgage History
| Date | Status | Borrower | Loan Amount |
|---|---|---|---|
| Previous Owner | Burton Clinet C | $92,000 |
Source: Public Records
Tax History Compared to Growth
Tax History
| Year | Tax Paid | Tax Assessment Tax Assessment Total Assessment is a certain percentage of the fair market value that is determined by local assessors to be the total taxable value of land and additions on the property. | Land | Improvement |
|---|---|---|---|---|
| 2025 | $1,451 | $49,200 | $49,200 | -- |
| 2023 | $1,451 | $70,800 | $70,800 | $0 |
| 2022 | $3,932 | $97,160 | $70,800 | $26,360 |
| 2021 | $1,528 | $37,720 | $16,800 | $20,920 |
| 2020 | $821 | $20,040 | $16,600 | $3,440 |
| 2019 | $497 | $20,920 | $11,680 | $9,240 |
| 2018 | $384 | $9,280 | $4,880 | $4,400 |
| 2017 | $366 | $8,480 | $5,760 | $2,720 |
| 2016 | $367 | $8,480 | $5,760 | $2,720 |
| 2015 | $883 | $8,480 | $5,760 | $2,720 |
| 2014 | $582 | $12,840 | $11,040 | $1,800 |
Source: Public Records
Map
Nearby Homes
- 923 N Eugenia Place NW
- 30 Johnson Rd NW
- 1039 Margaret Place NW
- 25 Johnson Rd NW
- 37 Johnson Rd NW
- 15 Johnson Rd NW
- 0 Cato St NW Unit 7588989
- 75 Johnson Rd NW
- 1886 Charles Place NW
- 888 Hollywood Rd NW
- 1974 Lois Place NW
- 856 Margaret Place NW
- 0 Newman Place NW Unit 7480374
- 2015 Lois Place NW
- 1981 Lois Place NW
- 1985 Lois Place NW
- 965 Cato St NW
- 38 Mildred NW
- 1987 Ruth St NW
- 960 N Eugenia Place NW
- 956 N Eugenia Place NW
- 970 N Eugenia Place NW
- 950 N Eugenia Place NW
- 974 N Eugenia Place NW
- 944 N Eugenia Place NW
- 1013 Sims Ave NW
- 1003 Sims Ave NW
- 993 Sims Ave NW
- 940 N Eugenia Place NW
- 977 N Eugenia Place NW
- 1015 Sims Ave NW
- 987 Sims Ave NW Unit A
- 987 Sims Ave NW Unit B
- 987 Sims Ave NW
- 987 Sims Ave NW Unit A
- 947 N Eugenia Place NW
- 0 Sims Ave Unit 8269545
- 0 Sims Ave Unit 8267879
- 0 Sims Ave Unit 5917044