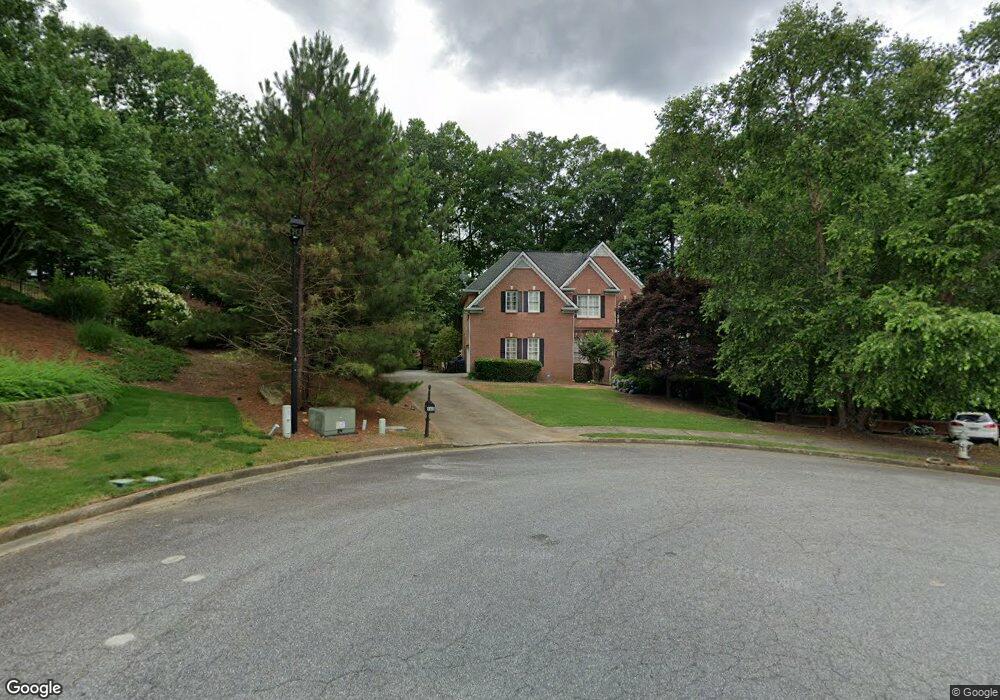
960 Riceland Ct Roswell, GA 30075
Estimated Value: $802,007 - $950,000
4
Beds
3
Baths
3,290
Sq Ft
$259/Sq Ft
Est. Value
About This Home
This home is located at 960 Riceland Ct, Roswell, GA 30075 and is currently estimated at $852,252, approximately $259 per square foot. 960 Riceland Ct is a home located in Fulton County with nearby schools including Mountain Park Elementary School, Crabapple Middle School, and Fellowship Christian School.
Ownership History
Date
Name
Owned For
Owner Type
Purchase Details
Closed on
Dec 30, 2009
Sold by
Lawson Andrea M
Bought by
Lawson Matthew J and Lawson Andrea M
Current Estimated Value
Home Financials for this Owner
Home Financials are based on the most recent Mortgage that was taken out on this home.
Original Mortgage
$342,000
Outstanding Balance
$221,446
Interest Rate
4.68%
Mortgage Type
New Conventional
Estimated Equity
$630,806
Purchase Details
Closed on
Oct 30, 2000
Sold by
Mercer William M
Bought by
Mercer Lori J
Purchase Details
Closed on
Dec 22, 1997
Sold by
First Standard Constr Co
Bought by
Chatell Peter M
Home Financials for this Owner
Home Financials are based on the most recent Mortgage that was taken out on this home.
Original Mortgage
$227,920
Interest Rate
7.23%
Mortgage Type
New Conventional
Create a Home Valuation Report for This Property
The Home Valuation Report is an in-depth analysis detailing your home's value as well as a comparison with similar homes in the area
Home Values in the Area
Average Home Value in this Area
Purchase History
| Date | Buyer | Sale Price | Title Company |
|---|---|---|---|
| Lawson Matthew J | -- | -- | |
| Lawson Andrea M | $360,000 | -- | |
| Mercer Lori J | -- | -- | |
| Chatell Peter M | $284,900 | -- |
Source: Public Records
Mortgage History
| Date | Status | Borrower | Loan Amount |
|---|---|---|---|
| Open | Lawson Andrea M | $342,000 | |
| Previous Owner | Chatell Peter M | $227,920 |
Source: Public Records
Tax History Compared to Growth
Tax History
| Year | Tax Paid | Tax Assessment Tax Assessment Total Assessment is a certain percentage of the fair market value that is determined by local assessors to be the total taxable value of land and additions on the property. | Land | Improvement |
|---|---|---|---|---|
| 2025 | $1,302 | $251,920 | $40,200 | $211,720 |
| 2023 | $5,556 | $196,840 | $49,800 | $147,040 |
| 2022 | $5,179 | $196,840 | $49,800 | $147,040 |
| 2021 | $6,087 | $191,120 | $48,360 | $142,760 |
| 2020 | $5,932 | $181,160 | $45,840 | $135,320 |
| 2019 | $898 | $181,160 | $45,840 | $135,320 |
| 2018 | $3,945 | $181,160 | $45,840 | $135,320 |
| 2017 | $4,078 | $139,760 | $26,440 | $113,320 |
| 2016 | $4,079 | $139,760 | $26,440 | $113,320 |
| 2015 | $4,858 | $139,760 | $26,440 | $113,320 |
| 2014 | $4,284 | $139,760 | $26,440 | $113,320 |
Source: Public Records
Map
Nearby Homes
- 1050 Lakemont Trace
- 295 Lakemont Dr
- 1024 Lake Charles Dr
- 980 Pine Grove Rd
- 5940 Plantation Dr
- 10555 Shallowford Rd
- 10565 Shallowford Rd
- 1085 Lake Charles Dr
- 10520 Shallowford Rd
- 965 Lake Charles Dr
- 1040 Wordsworth Dr
- 10745 Shallowford Rd
- 10765 Shallowford Rd
- 2095 Shallowford Park Manor
- 610 Pine Grove Rd
- 230 Tynebrae Place Unit 1
- 555 Ramsdale Dr
- 0 Riceland Ct Unit 7383226
- 0 Riceland Ct Unit 7333733
- 0 Riceland Ct Unit 8546033
- 0 Riceland Ct Unit 8416536
- 0 Riceland Ct Unit 8184021
- 0 Riceland Ct Unit 7552033
- 0 Riceland Ct Unit 8398278
- 0 Riceland Ct Unit 7120439
- 0 Riceland Ct Unit 8444591
- 0 Riceland Ct Unit 7529801
- 0 Riceland Ct Unit 7287911
- 970 Riceland Ct
- 965 Riceland Ct
- 975 Riceland Ct
- 3050 Bluffton Way
- 980 Riceland Ct
- 3015 Bluffton Way
- 985 Riceland Ct
- 3055 Bluffton Way
- 990 Riceland Ct