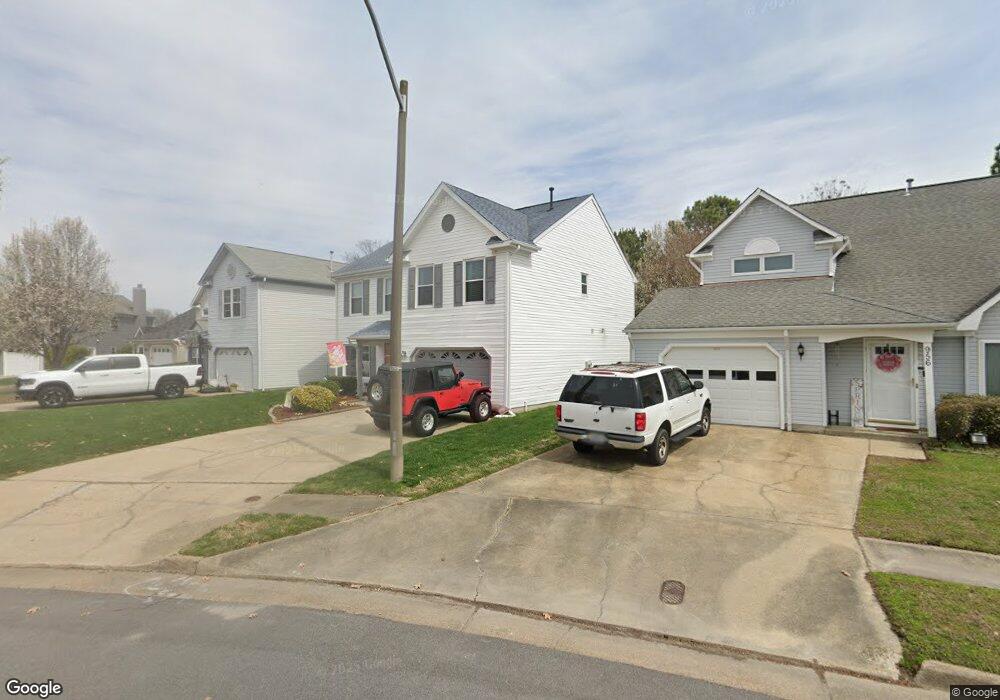
960 Summerside Ct Virginia Beach, VA 23456
Estimated Value: $459,000 - $490,000
4
Beds
3
Baths
1,916
Sq Ft
$247/Sq Ft
Est. Value
About This Home
This home is located at 960 Summerside Ct, Virginia Beach, VA 23456 and is currently estimated at $472,883, approximately $246 per square foot. 960 Summerside Ct is a home located in Virginia Beach City with nearby schools including Glenwood Elementary School, Salem Middle School, and Salem High School.
Ownership History
Date
Name
Owned For
Owner Type
Purchase Details
Closed on
Aug 29, 2017
Sold by
Pang Koon Wah and Pang Jillian
Bought by
Rhodes Kevin
Current Estimated Value
Home Financials for this Owner
Home Financials are based on the most recent Mortgage that was taken out on this home.
Original Mortgage
$265,109
Outstanding Balance
$223,787
Interest Rate
4.4%
Mortgage Type
FHA
Estimated Equity
$249,096
Purchase Details
Closed on
Feb 23, 2005
Sold by
Irby Kurtis D
Bought by
Pang Koon Wah
Home Financials for this Owner
Home Financials are based on the most recent Mortgage that was taken out on this home.
Original Mortgage
$213,556
Interest Rate
5.66%
Mortgage Type
FHA
Purchase Details
Closed on
May 24, 2001
Sold by
Klaus Jerry E
Bought by
Irby Kurtis D
Home Financials for this Owner
Home Financials are based on the most recent Mortgage that was taken out on this home.
Original Mortgage
$142,661
Interest Rate
7.05%
Create a Home Valuation Report for This Property
The Home Valuation Report is an in-depth analysis detailing your home's value as well as a comparison with similar homes in the area
Home Values in the Area
Average Home Value in this Area
Purchase History
| Date | Buyer | Sale Price | Title Company |
|---|---|---|---|
| Rhodes Kevin | $270,000 | Attorney | |
| Pang Koon Wah | $263,000 | -- | |
| Irby Kurtis D | $144,900 | -- |
Source: Public Records
Mortgage History
| Date | Status | Borrower | Loan Amount |
|---|---|---|---|
| Open | Rhodes Kevin | $265,109 | |
| Previous Owner | Pang Koon Wah | $213,556 | |
| Previous Owner | Irby Kurtis D | $142,661 |
Source: Public Records
Tax History Compared to Growth
Tax History
| Year | Tax Paid | Tax Assessment Tax Assessment Total Assessment is a certain percentage of the fair market value that is determined by local assessors to be the total taxable value of land and additions on the property. | Land | Improvement |
|---|---|---|---|---|
| 2025 | $3,733 | $402,300 | $173,000 | $229,300 |
| 2024 | $3,733 | $384,800 | $165,000 | $219,800 |
| 2023 | $3,644 | $368,100 | $145,000 | $223,100 |
| 2022 | $3,284 | $331,700 | $126,500 | $205,200 |
| 2021 | $2,993 | $302,300 | $115,000 | $187,300 |
| 2020 | $2,760 | $271,300 | $96,000 | $175,300 |
| 2019 | $2,705 | $264,900 | $94,000 | $170,900 |
| 2018 | $2,656 | $264,900 | $94,000 | $170,900 |
| 2017 | $2,609 | $260,200 | $94,000 | $166,200 |
| 2016 | $2,495 | $252,000 | $92,000 | $160,000 |
| 2015 | $2,362 | $238,600 | $87,500 | $151,100 |
| 2014 | $2,199 | $236,400 | $107,500 | $128,900 |
Source: Public Records
Map
Nearby Homes
- 940 Summerside Ct
- 2708 Ada Arch
- 5224 Thatcher Way
- 5245 Thatcher Way
- 1001 Villas Ct
- 5012 Thatcher Way
- 1912 Bunnell Ct
- 1184 Eagle Way
- 1652 Castlefield Rd
- 4252 Spruce Knob Rd
- 1232 Northvale Dr
- 2309 Creekview Dr
- 1900 Haywards Heath
- 1932 Grey Friars Chase
- 4736 Ardmore Ln
- 2009 Swanton Ct
- 2148 Dove Ridge Dr
- 4764 Ardmore Ln
- 3528 Pons Dr
- 5056 Heathglen Cir
- 2008 Winding Lake Ct
- 956 Summerside Ct
- 2004 Winding Lake Ct
- 952 Summerside Ct
- 957 Summerside Ct
- 948 Summerside Ct
- 2000 Winding Lake Ct
- 961 Summerside Ct
- 968 Summerside Ct
- 944 Summerside Ct
- 2001 Winding Lake Ct
- 2005 Winding Lake Ct
- 965 Summerside Ct
- 972 Summerside Ct
- 945 Summerside Ct
- 2004 Winding Wood Ct
- 936 Summerside Ct
- 976 Summerside Ct
- 941 Summerside Ct
- 2008 Springside Ct