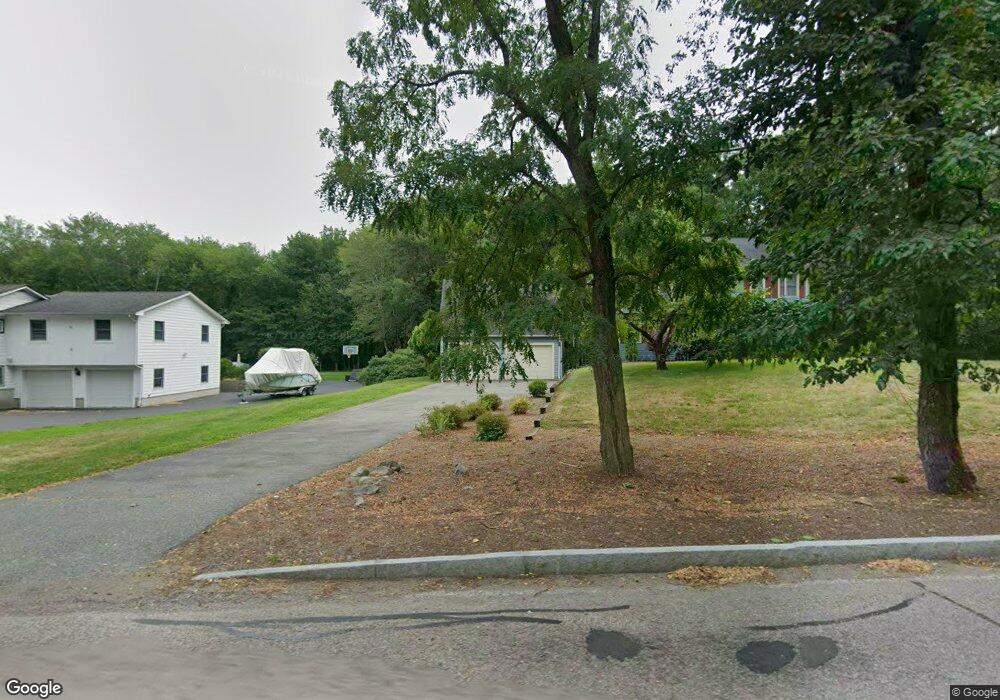
960 West St Mansfield, MA 02048
Estimated Value: $748,239 - $897,000
4
Beds
3
Baths
1,978
Sq Ft
$413/Sq Ft
Est. Value
About This Home
This home is located at 960 West St, Mansfield, MA 02048 and is currently estimated at $817,060, approximately $413 per square foot. 960 West St is a home located in Bristol County with nearby schools including Everett W. Robinson Elementary School, Jordan/Jackson Elementary School, and Harold L. Qualters Middle School.
Ownership History
Date
Name
Owned For
Owner Type
Purchase Details
Closed on
Jul 10, 1991
Sold by
Budnick Larry C and Budnick Eve K
Bought by
Heitin Randy
Current Estimated Value
Home Financials for this Owner
Home Financials are based on the most recent Mortgage that was taken out on this home.
Original Mortgage
$142,000
Interest Rate
9.35%
Mortgage Type
Purchase Money Mortgage
Purchase Details
Closed on
Jan 14, 1988
Sold by
Leary Paul
Bought by
Budnick Larry C
Create a Home Valuation Report for This Property
The Home Valuation Report is an in-depth analysis detailing your home's value as well as a comparison with similar homes in the area
Home Values in the Area
Average Home Value in this Area
Purchase History
| Date | Buyer | Sale Price | Title Company |
|---|---|---|---|
| Heitin Randy | $177,500 | -- | |
| Budnick Larry C | $200,000 | -- |
Source: Public Records
Mortgage History
| Date | Status | Borrower | Loan Amount |
|---|---|---|---|
| Closed | Budnick Larry C | $143,200 | |
| Closed | Budnick Larry C | $143,200 | |
| Closed | Budnick Larry C | $143,200 | |
| Closed | Budnick Larry C | $142,000 |
Source: Public Records
Tax History
| Year | Tax Paid | Tax Assessment Tax Assessment Total Assessment is a certain percentage of the fair market value that is determined by local assessors to be the total taxable value of land and additions on the property. | Land | Improvement |
|---|---|---|---|---|
| 2025 | $8,291 | $629,500 | $245,600 | $383,900 |
| 2024 | $8,141 | $603,000 | $245,600 | $357,400 |
| 2023 | $7,909 | $561,300 | $245,600 | $315,700 |
| 2022 | $7,582 | $499,800 | $227,300 | $272,500 |
| 2021 | $7,382 | $480,600 | $199,000 | $281,600 |
| 2020 | $7,127 | $464,000 | $189,500 | $274,500 |
| 2019 | $6,616 | $434,700 | $157,800 | $276,900 |
| 2018 | $3,451 | $422,800 | $150,600 | $272,200 |
| 2017 | $6,179 | $411,400 | $146,300 | $265,100 |
| 2016 | $5,740 | $372,500 | $139,200 | $233,300 |
| 2015 | $5,602 | $361,400 | $139,200 | $222,200 |
Source: Public Records
Map
Nearby Homes
- 1769 West St
- 24 Maverick Dr
- 85 Jewell St
- 346 South St
- 40 Treasure Island Rd
- 14 Claire Ave
- 152 Central St
- 16 Treasure Island Rd
- 150 Gilbert St
- 166 Chauncy St
- 356 Central St
- 9 Coach Rd
- 33 Colonial Way
- 84 Messenger St
- 150 Rumford Ave Unit 110
- 46 Mirimichi St
- 266 N Main St Unit 3
- 155 South St
- 28 Court St
- 22 Pleasant St Unit C
Your Personal Tour Guide
Ask me questions while you tour the home.