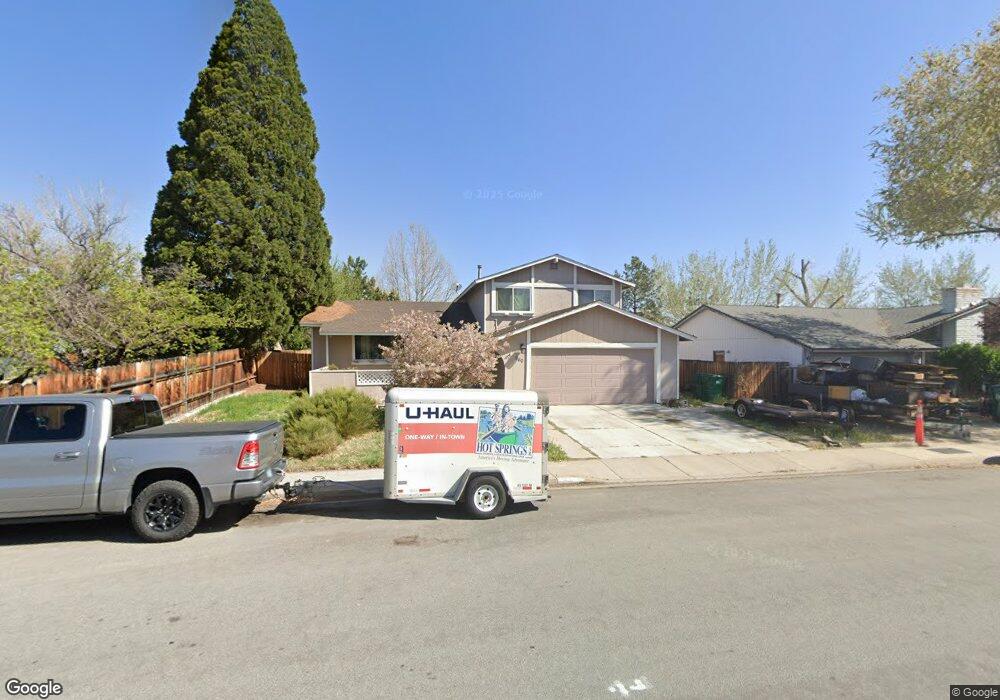
960 Woodstone Dr Sparks, NV 89434
Reed NeighborhoodEstimated Value: $437,000 - $601,000
4
Beds
3
Baths
2,128
Sq Ft
$233/Sq Ft
Est. Value
About This Home
This home is located at 960 Woodstone Dr, Sparks, NV 89434 and is currently estimated at $496,659, approximately $233 per square foot. 960 Woodstone Dr is a home located in Washoe County with nearby schools including Lena Juniper Elementary School, Lou Mendive Middle School, and Edward C Reed High School.
Ownership History
Date
Name
Owned For
Owner Type
Purchase Details
Closed on
Sep 25, 2002
Sold by
Chibante Dale
Bought by
Chibante Dale and Chibante Pamela
Current Estimated Value
Home Financials for this Owner
Home Financials are based on the most recent Mortgage that was taken out on this home.
Original Mortgage
$139,093
Outstanding Balance
$58,356
Interest Rate
6.17%
Estimated Equity
$438,303
Purchase Details
Closed on
May 3, 2001
Sold by
Roman Catholic Bishop Of Reno Las Vegas
Bought by
Chibante Dale
Home Financials for this Owner
Home Financials are based on the most recent Mortgage that was taken out on this home.
Original Mortgage
$122,250
Interest Rate
6.92%
Mortgage Type
Stand Alone First
Purchase Details
Closed on
Apr 3, 2001
Sold by
Chibante Pamela A
Bought by
Chibante Dale
Home Financials for this Owner
Home Financials are based on the most recent Mortgage that was taken out on this home.
Original Mortgage
$122,250
Interest Rate
6.92%
Mortgage Type
Stand Alone First
Create a Home Valuation Report for This Property
The Home Valuation Report is an in-depth analysis detailing your home's value as well as a comparison with similar homes in the area
Home Values in the Area
Average Home Value in this Area
Purchase History
| Date | Buyer | Sale Price | Title Company |
|---|---|---|---|
| Chibante Dale | $172,433 | Founders Title Co | |
| Chibante Dale | $163,000 | First American Title | |
| Chibante Dale | -- | First American Title |
Source: Public Records
Mortgage History
| Date | Status | Borrower | Loan Amount |
|---|---|---|---|
| Open | Chibante Dale | $139,093 | |
| Closed | Chibante Dale | $122,250 |
Source: Public Records
Tax History Compared to Growth
Tax History
| Year | Tax Paid | Tax Assessment Tax Assessment Total Assessment is a certain percentage of the fair market value that is determined by local assessors to be the total taxable value of land and additions on the property. | Land | Improvement |
|---|---|---|---|---|
| 2025 | $1,875 | $70,712 | $36,120 | $34,592 |
| 2024 | $1,875 | $68,996 | $33,215 | $35,781 |
| 2023 | $1,821 | $69,905 | $35,175 | $34,730 |
| 2022 | $1,768 | $56,401 | $26,740 | $29,661 |
| 2021 | $1,717 | $51,892 | $21,735 | $30,157 |
| 2020 | $1,666 | $51,568 | $20,720 | $30,848 |
| 2019 | $1,617 | $51,210 | $20,720 | $30,490 |
| 2018 | $1,570 | $44,759 | $14,455 | $30,304 |
| 2017 | $1,525 | $44,607 | $13,720 | $30,887 |
| 2016 | $1,487 | $44,229 | $12,250 | $31,979 |
| 2015 | $1,484 | $43,010 | $10,325 | $32,685 |
| 2014 | $1,441 | $40,779 | $9,030 | $31,749 |
| 2013 | -- | $38,545 | $6,860 | $31,685 |
Source: Public Records
Map
Nearby Homes
- 1002 Baywood Dr Unit A
- 1020 Baywood Dr Unit B
- 1002 Glen Meadow Dr
- 930 Spanish Springs Rd
- 1041 Baywood Dr Unit B
- 1029 Baywood Dr Unit D
- 1040 #87 Baywood Unit C
- 1064 Bradley Square
- 3167 Bristle Branch Dr
- 3188 Bristle Branch Dr
- 3200 Bristle Branch Dr
- 1035 Baywood Dr Unit D
- 1095 E York Way
- 1069 Palmwood Dr
- 1051 Baywood Dr Unit A
- 1055 Baywood Dr Unit D
- 1044 Glen Martin Dr
- 3104 Sandy St
- 3221 Edna Ct
- 383 E Emerson Way
- 956 Supreme Ct
- 952 Supreme Ct
- 970 Woodstone Dr
- 948 Supreme Ct
- 965 Madrone Cir
- 976 Woodstone Dr
- 971 Ashwood Cir
- 935 Madrone Cir Unit 3
- 961 Madrone Cir
- 944 Supreme Ct
- 930 Supreme Ct
- 975 Ashwood Cir
- 934 Supreme Ct
- 980 Woodstone Dr
- 941 Madrone Cir
- 938 Supreme Ct
- 942 Supreme Ct
- 931 Birchwood Cir
- 955 Madrone Cir
- 951 Madrone Cir