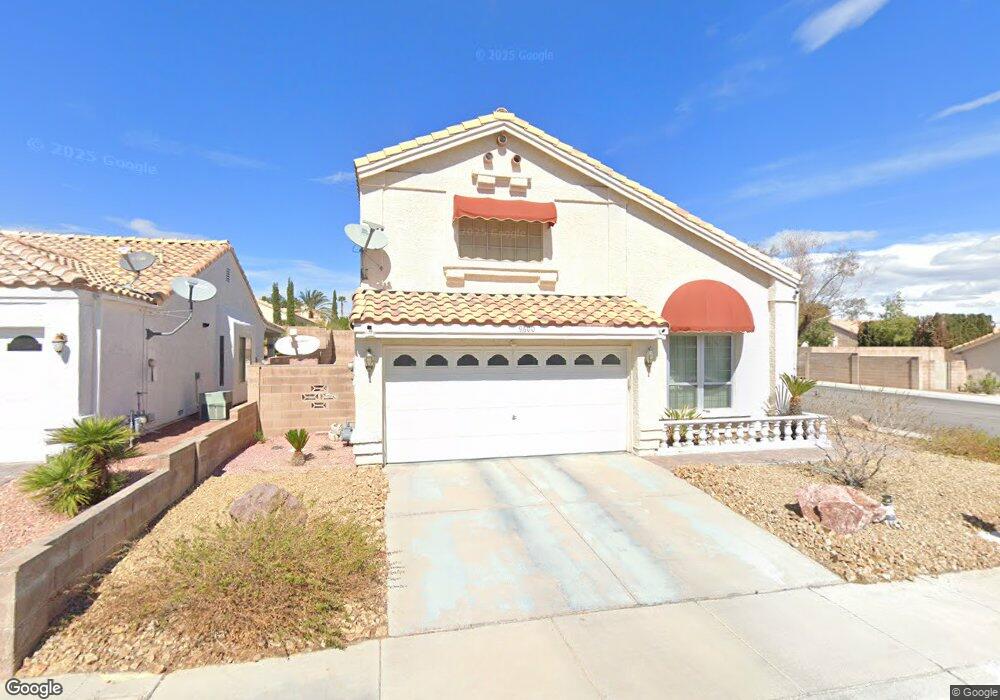
9600 Lazy River Dr Las Vegas, NV 89117
The Section Seven NeighborhoodEstimated Value: $452,000 - $545,000
4
Beds
3
Baths
2,099
Sq Ft
$241/Sq Ft
Est. Value
About This Home
This home is located at 9600 Lazy River Dr, Las Vegas, NV 89117 and is currently estimated at $506,178, approximately $241 per square foot. 9600 Lazy River Dr is a home located in Clark County with nearby schools including M J Christensen Elementary School, Clifford J Lawrence Junior High School, and Bonanza High School.
Ownership History
Date
Name
Owned For
Owner Type
Purchase Details
Closed on
Dec 28, 2000
Sold by
Barron Gerardo Filio
Bought by
Lacangan Cheryl J
Current Estimated Value
Home Financials for this Owner
Home Financials are based on the most recent Mortgage that was taken out on this home.
Original Mortgage
$143,840
Outstanding Balance
$53,045
Interest Rate
7.71%
Estimated Equity
$453,133
Purchase Details
Closed on
Dec 22, 2000
Sold by
Lacangan Purita J and Lacangan Emmanuel
Bought by
Horn Sidney W
Home Financials for this Owner
Home Financials are based on the most recent Mortgage that was taken out on this home.
Original Mortgage
$143,840
Outstanding Balance
$53,045
Interest Rate
7.71%
Estimated Equity
$453,133
Create a Home Valuation Report for This Property
The Home Valuation Report is an in-depth analysis detailing your home's value as well as a comparison with similar homes in the area
Home Values in the Area
Average Home Value in this Area
Purchase History
| Date | Buyer | Sale Price | Title Company |
|---|---|---|---|
| Lacangan Cheryl J | -- | First American Title Co | |
| Horn Sidney W | $160,000 | First American Title Co |
Source: Public Records
Mortgage History
| Date | Status | Borrower | Loan Amount |
|---|---|---|---|
| Open | Horn Sidney W | $143,840 |
Source: Public Records
Tax History Compared to Growth
Tax History
| Year | Tax Paid | Tax Assessment Tax Assessment Total Assessment is a certain percentage of the fair market value that is determined by local assessors to be the total taxable value of land and additions on the property. | Land | Improvement |
|---|---|---|---|---|
| 2025 | $2,232 | $93,758 | $37,100 | $56,658 |
| 2024 | $2,168 | $93,758 | $37,100 | $56,658 |
| 2023 | $2,168 | $93,158 | $38,500 | $54,658 |
| 2022 | $2,105 | $79,984 | $29,750 | $50,234 |
| 2021 | $2,044 | $75,511 | $27,300 | $48,211 |
| 2020 | $1,981 | $73,725 | $25,550 | $48,175 |
| 2019 | $1,923 | $74,729 | $26,950 | $47,779 |
| 2018 | $1,867 | $72,656 | $26,600 | $46,056 |
| 2017 | $2,353 | $71,777 | $24,850 | $46,927 |
| 2016 | $1,769 | $64,797 | $17,500 | $47,297 |
| 2015 | $1,765 | $56,779 | $16,450 | $40,329 |
| 2014 | $1,713 | $50,696 | $8,750 | $41,946 |
Source: Public Records
Map
Nearby Homes
- 9544 Lazy River Dr
- 2728 Monrovia Dr
- 2724 Monrovia Dr
- 9708 Blazing Star Ct
- 2701 Purtell Cir
- 9724 Cascade Falls Ave
- 9713 Cascade Falls Ave
- 9429 Abalone Way
- 3001 Bridge Creek St
- 2300 Storkspur Way
- 2821 Willow Wind Ct
- 9605 Blowing Sand Cir
- 2913 Domino Way
- 9624 Beach Water Cir
- 2712 Quail Roost Way
- 9717 Sierra Mesa Ave
- 9548 Wooden Pier Way
- 3009 Periscope Ct
- 2909 Ivory Reef Ct
- 9504 Cliff View Way
- 9604 Lazy River Dr Unit 9B
- 9601 Chianti Ln
- 9608 Lazy River Dr
- 9605 Chianti Ln
- 9545 Chianti Ln Unit 9B
- 9609 Chianti Ln
- 9601 Lazy River Dr
- 9605 Lazy River Dr
- 9612 Lazy River Dr
- 9540 Lazy River Dr
- 9609 Lazy River Dr
- 9541 Chianti Ln Unit 9b
- 9541 Chianti Ln
- 9613 Chianti Ln
- 9545 Lazy River Dr
- 9536 Lazy River Dr
- 9541 Lazy River Dr
- 9537 Chianti Ln Unit 9B
- 9537 Chianti Ln
- 9613 Lazy River Dr