9600 SW 89th St Mustang, OK 73064
South Mustang NeighborhoodEstimated Value: $449,000 - $555,000
3
Beds
2
Baths
2,376
Sq Ft
$207/Sq Ft
Est. Value
About This Home
This home is located at 9600 SW 89th St, Mustang, OK 73064 and is currently estimated at $492,662, approximately $207 per square foot. 9600 SW 89th St is a home located in Canadian County with nearby schools including Mustang Elementary School, Mustang Horizon Intermediate School, and Mustang Middle School.
Ownership History
Date
Name
Owned For
Owner Type
Purchase Details
Closed on
Dec 28, 2020
Sold by
George Shelly
Bought by
George Troy S
Current Estimated Value
Purchase Details
Closed on
Mar 3, 2014
Sold by
Lindsay Jeffrey
Bought by
Shelly George Troy S and Shelly George
Home Financials for this Owner
Home Financials are based on the most recent Mortgage that was taken out on this home.
Original Mortgage
$332,500
Outstanding Balance
$252,214
Interest Rate
4.36%
Estimated Equity
$240,448
Purchase Details
Closed on
May 20, 2011
Sold by
Lindsay Brenda
Bought by
Lindsay Jeffrey
Purchase Details
Closed on
May 30, 2001
Sold by
Streeter Properties Inc
Create a Home Valuation Report for This Property
The Home Valuation Report is an in-depth analysis detailing your home's value as well as a comparison with similar homes in the area
Home Values in the Area
Average Home Value in this Area
Purchase History
| Date | Buyer | Sale Price | Title Company |
|---|---|---|---|
| George Troy S | -- | None Available | |
| Shelly George Troy S | $350,000 | Ort | |
| Lindsay Jeffrey | -- | None Available | |
| -- | $34,000 | -- |
Source: Public Records
Mortgage History
| Date | Status | Borrower | Loan Amount |
|---|---|---|---|
| Open | Shelly George Troy S | $332,500 |
Source: Public Records
Tax History Compared to Growth
Tax History
| Year | Tax Paid | Tax Assessment Tax Assessment Total Assessment is a certain percentage of the fair market value that is determined by local assessors to be the total taxable value of land and additions on the property. | Land | Improvement |
|---|---|---|---|---|
| 2024 | $4,788 | $44,585 | $8,400 | $36,185 |
| 2023 | $4,788 | $43,287 | $7,675 | $35,612 |
| 2022 | $4,716 | $42,026 | $7,675 | $34,351 |
| 2021 | $4,884 | $42,648 | $7,675 | $34,973 |
| 2020 | $4,816 | $42,636 | $7,495 | $35,141 |
| 2019 | $4,668 | $41,395 | $6,866 | $34,529 |
| 2018 | $4,613 | $40,189 | $6,396 | $33,793 |
| 2017 | $4,432 | $39,146 | $5,269 | $33,877 |
| 2016 | $4,288 | $38,955 | $5,269 | $33,686 |
| 2015 | $3,456 | $36,899 | $5,269 | $31,630 |
| 2014 | $3,456 | $30,596 | $4,029 | $26,567 |
Source: Public Records
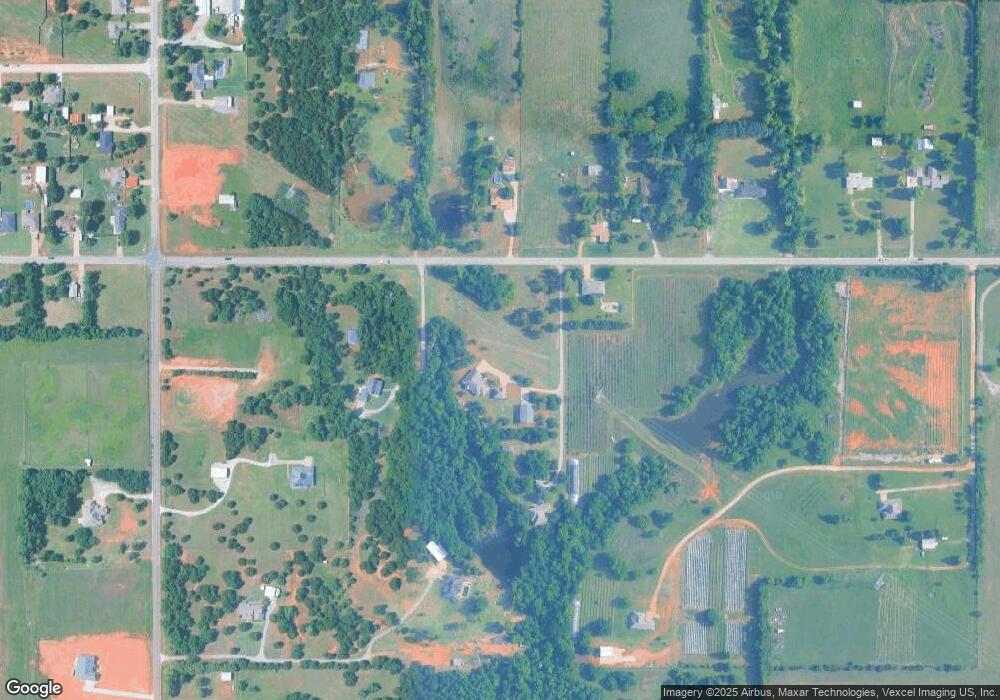
Map
Nearby Homes
- 1301 S Morgan Rd
- 9109 Prairie Farms Dr
- 1229 E Ruger Ln
- 1225 E Ruger Ln
- 1221 E Ruger Ln
- 1228 E Ruger Ln
- Ellie Plan at Prairie Estates
- Emma Plan at Prairie Estates
- Maddie Plan at Prairie Estates
- Saddie Plan at Prairie Estates
- Preston Plan at Prairie Estates
- Logan Plan at Prairie Estates
- Collin Plan at Prairie Estates
- Hudson Plan at Prairie Estates
- Patrick Plan at Prairie Estates
- Wade Plan at Prairie Estates
- Lyla Plan at Prairie Estates
- Elle Plan at Prairie Estates
- Ledger Plan at Prairie Estates
- Drew Plan at Prairie Estates
- 9640 SW 89th St
- 9540 SW 89th St
- 1841 E Sw 89th St
- 1841 E Sw 89th St
- 1907 E Sw 89th St
- 9200 S Morgan Rd
- 9601 SW 93rd St
- 1915 E Sw 89th St
- 9211 S Sloan Rd
- 9701 SW 93rd St
- 1801 E Sw 89th St
- 1801 E Sw 89th St Unit ESW
- 1947 E Sw 89th St
- 1517 S Morgan Rd
- 9201 S Morgan Rd
- 1460 S Morgan Rd
- 1429 S Morgan Rd
- 9205 S Sloan Rd
- 2035 E Sw 89th St
- 2035 E Sw 89th St