Estimated Value: $565,924 - $656,000
3
Beds
2
Baths
2,077
Sq Ft
$289/Sq Ft
Est. Value
About This Home
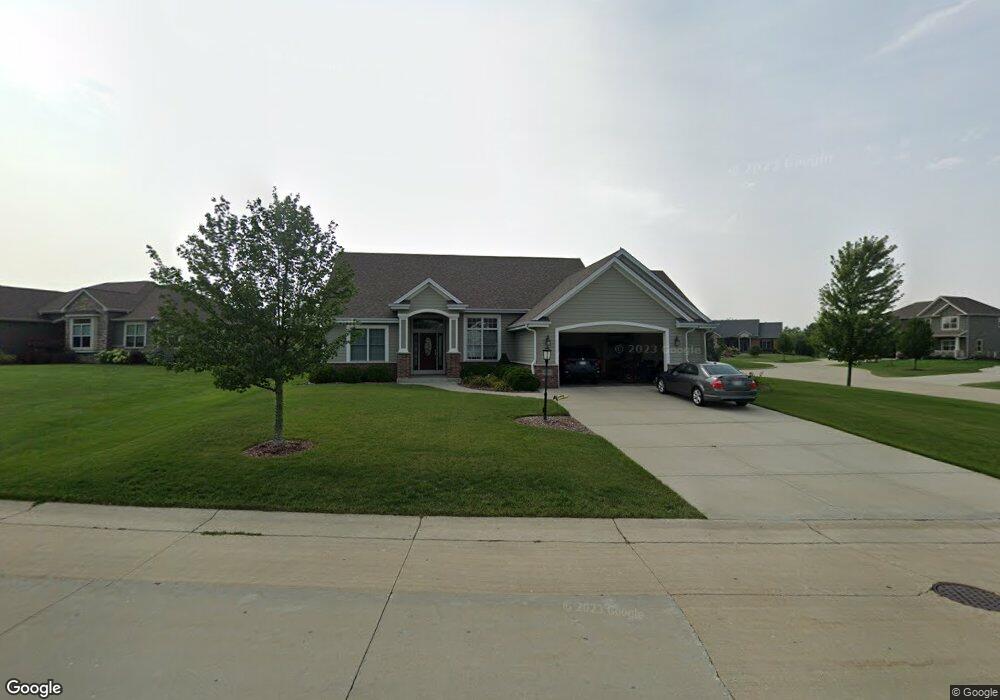
This home is located at 9602 49th Ct, Pleasant Prairie, WI 53158 and is currently estimated at $600,731, approximately $289 per square foot. 9602 49th Ct is a home with nearby schools including Prairie Lane Elementary School, Mahone Middle School, and Indian Trail High School And Academy.
Ownership History
Date
Name
Owned For
Owner Type
Purchase Details
Closed on
Aug 6, 2021
Sold by
Denisi Frank R
Bought by
Denisi Frank R and Denisi Revocable Trust
Current Estimated Value
Purchase Details
Closed on
Jan 17, 2020
Sold by
Covelli Lanise M and Patrizzi Thomas G
Bought by
Denisi Frank
Home Financials for this Owner
Home Financials are based on the most recent Mortgage that was taken out on this home.
Original Mortgage
$344,802
Interest Rate
3.6%
Mortgage Type
New Conventional
Purchase Details
Closed on
Jan 17, 2013
Sold by
Riversview Development Llc A Wisconsin L
Bought by
Covelli Lanise M
Create a Home Valuation Report for This Property
The Home Valuation Report is an in-depth analysis detailing your home's value as well as a comparison with similar homes in the area
Home Values in the Area
Average Home Value in this Area
Purchase History
| Date | Buyer | Sale Price | Title Company |
|---|---|---|---|
| Denisi Frank R | -- | None Available | |
| Denisi Frank | $363,000 | None Available | |
| Covelli Lanise M | $50,000 | -- |
Source: Public Records
Mortgage History
| Date | Status | Borrower | Loan Amount |
|---|---|---|---|
| Previous Owner | Denisi Frank | $344,802 |
Source: Public Records
Tax History Compared to Growth
Tax History
| Year | Tax Paid | Tax Assessment Tax Assessment Total Assessment is a certain percentage of the fair market value that is determined by local assessors to be the total taxable value of land and additions on the property. | Land | Improvement |
|---|---|---|---|---|
| 2024 | $6,131 | $534,300 | $111,800 | $422,500 |
| 2023 | $6,013 | $457,600 | $101,900 | $355,700 |
| 2022 | $6,121 | $457,600 | $101,900 | $355,700 |
| 2021 | $6,783 | $367,300 | $78,900 | $288,400 |
| 2020 | $6,911 | $367,300 | $78,900 | $288,400 |
| 2019 | $6,293 | $364,400 | $78,900 | $285,500 |
| 2018 | $6,421 | $364,400 | $78,900 | $285,500 |
| 2017 | $6,873 | $318,500 | $67,700 | $250,800 |
| 2016 | $6,786 | $318,500 | $67,700 | $250,800 |
| 2015 | $5,993 | $297,200 | $60,500 | $236,700 |
| 2014 | $1,321 | $297,200 | $60,500 | $236,700 |
Source: Public Records
Map
Nearby Homes