O
Seller's Agent in 2019
Olga Griffin
My Home Group Real Estate
(602) 570-1652
49 in this area
162 Total Sales
Estimated Value: $285,000 - $414,000
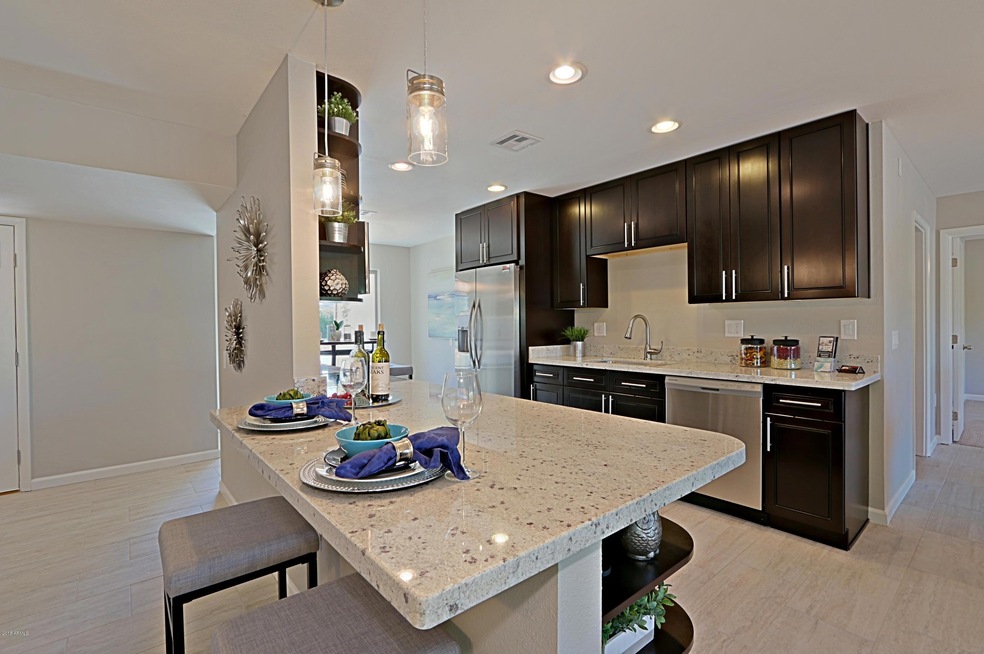
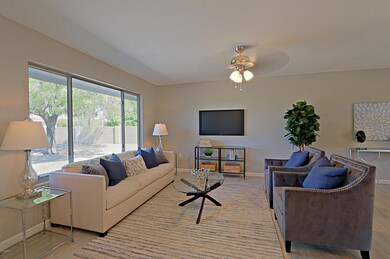
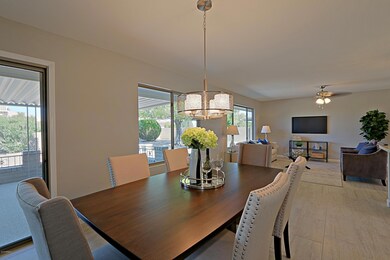
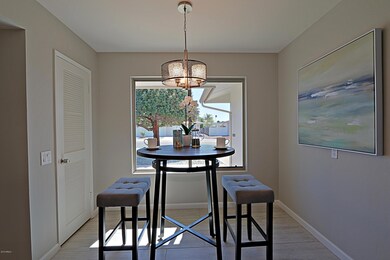
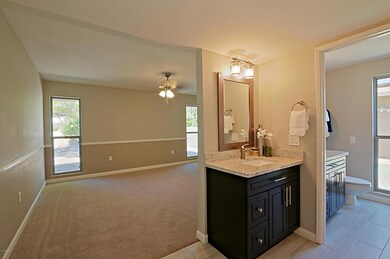
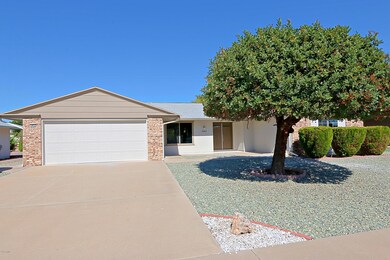
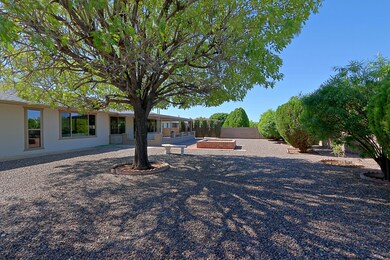
Enjoy retirement in its best! Completely renovated and ready to move-in. Open floor plan with formal dining room, spacious kitchen, 3 bedrooms, 2 baths, 2 car garage. Highly upgraded with tile flooring t/o, carpet in bedrooms, custom cabinets, granite countertops, Stainless steel appliances including fridge, kitchen breakfast bar. New light and plumbing fixtures, new interior and exterior paint, new dual pane windows. Master suite offers double sinks and walk-in closet. Roof and HVAC replaced in 2010. Newer water heater, inside laundry. Large covered patio with block fencing in backyard. Home warranty included, this home is 10! Hurry, will not last long!
Last Agent to Sell the Property
My Home Group Real Estate License #BR543289000 Listed on: 10/18/2018

| Date | Buyer | Sale Price | Title Company |
|---|---|---|---|
| Boyer Thomas R | $282,000 | Pioneer Title Agency Inc | |
| Rocking Horse Llc | $182,000 | Pioneer Title Agency Inc |
| Date | Status | Borrower | Loan Amount |
|---|---|---|---|
| Open | Boyer Thomas R | $225,600 | |
| Previous Owner | Rocking Horse Llc | $145,600 |
| Date | Event | Price | List to Sale | Price per Sq Ft | Prior Sale |
|---|---|---|---|---|---|
| 02/22/2019 02/22/19 | Sold | $282,000 | -0.5% | $152 / Sq Ft | |
| 02/02/2019 02/02/19 | Pending | -- | -- | -- | |
| 01/15/2019 01/15/19 | Price Changed | $283,500 | -0.5% | $153 / Sq Ft | |
| 12/06/2018 12/06/18 | For Sale | $285,000 | 0.0% | $154 / Sq Ft | |
| 11/30/2018 11/30/18 | Pending | -- | -- | -- | |
| 11/19/2018 11/19/18 | Price Changed | $285,000 | -1.0% | $154 / Sq Ft | |
| 10/18/2018 10/18/18 | For Sale | $287,900 | +58.2% | $156 / Sq Ft | |
| 08/27/2018 08/27/18 | Sold | $182,000 | -4.2% | $114 / Sq Ft | View Prior Sale |
| 07/26/2018 07/26/18 | Pending | -- | -- | -- | |
| 07/23/2018 07/23/18 | For Sale | $189,900 | -- | $119 / Sq Ft |
| Year | Tax Paid | Tax Assessment Tax Assessment Total Assessment is a certain percentage of the fair market value that is determined by local assessors to be the total taxable value of land and additions on the property. | Land | Improvement |
|---|---|---|---|---|
| 2025 | $1,172 | $14,572 | -- | -- |
| 2024 | $1,056 | $13,878 | -- | -- |
| 2023 | $1,056 | $23,470 | $4,690 | $18,780 |
| 2022 | $991 | $18,420 | $3,680 | $14,740 |
| 2021 | $1,024 | $17,300 | $3,460 | $13,840 |
| 2020 | $996 | $15,300 | $3,060 | $12,240 |
| 2019 | $983 | $14,350 | $2,870 | $11,480 |
| 2018 | $945 | $13,070 | $2,610 | $10,460 |
| 2017 | $913 | $11,610 | $2,320 | $9,290 |
| 2016 | $855 | $10,960 | $2,190 | $8,770 |
| 2015 | $816 | $10,170 | $2,030 | $8,140 |
O
Seller's Agent in 2019
Olga Griffin
My Home Group Real Estate
(602) 570-1652
49 in this area
162 Total Sales
Buyer's Agent in 2019
Sarah Davis
West USA Realty
(623) 262-0000
21 in this area
21 Total Sales
Seller's Agent in 2018
Lisa Brazsky
HomeSmart
(602) 292-4089
20 Total Sales
Source: Arizona Regional Multiple Listing Service (ARMLS)
MLS Number: 5834885
APN: 200-93-484
Disclaimer: Certain information contained herein is derived from information provided by parties other than Homes.com. All information provided is deemed reliable, but is not guaranteed to be accurate and should be independently verified.
![]() All information should be verified by the recipient and none is guaranteed as accurate by ARMLS
All information should be verified by the recipient and none is guaranteed as accurate by ARMLS
Listing Information presented by local MLS brokerage: Ten-X, local REALTOR®- Arlene Richardson - (888)-952-6393