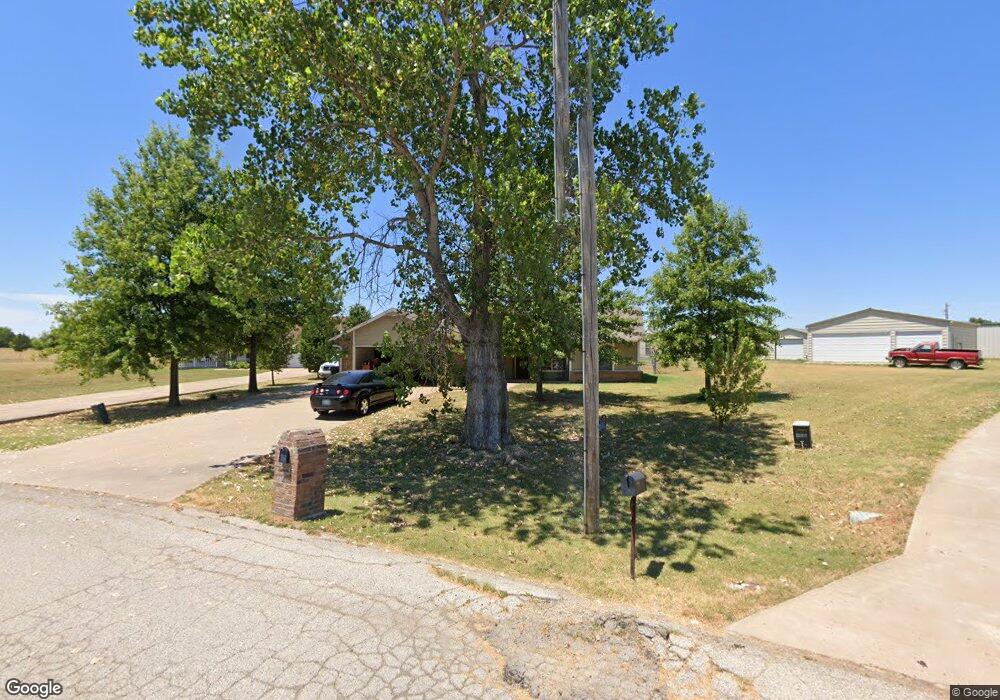
9603 E 115th St N Owasso, OK 74055
Estimated Value: $250,000 - $266,562
--
Bed
2
Baths
1,415
Sq Ft
$181/Sq Ft
Est. Value
About This Home
This home is located at 9603 E 115th St N, Owasso, OK 74055 and is currently estimated at $256,641, approximately $181 per square foot. 9603 E 115th St N is a home located in Tulsa County with nearby schools including Barnes Elementary School, Owasso 6th Grade Center, and Owasso 7th Grade Center.
Ownership History
Date
Name
Owned For
Owner Type
Purchase Details
Closed on
Oct 5, 2022
Sold by
Craig N Michaelson Revocable Living Trus
Bought by
Preisser David J and Preisser Jean M
Current Estimated Value
Purchase Details
Closed on
Mar 12, 2007
Sold by
Homesales Inc
Bought by
Michaelson Craig
Home Financials for this Owner
Home Financials are based on the most recent Mortgage that was taken out on this home.
Original Mortgage
$103,950
Interest Rate
6.26%
Mortgage Type
Purchase Money Mortgage
Purchase Details
Closed on
Dec 13, 2006
Sold by
Vanscoy Marjorie L
Bought by
Homesales Inc
Purchase Details
Closed on
Dec 30, 1999
Sold by
Maximum Controls Inc
Bought by
Brown Marjorie L
Home Financials for this Owner
Home Financials are based on the most recent Mortgage that was taken out on this home.
Original Mortgage
$94,951
Interest Rate
7.69%
Mortgage Type
FHA
Create a Home Valuation Report for This Property
The Home Valuation Report is an in-depth analysis detailing your home's value as well as a comparison with similar homes in the area
Home Values in the Area
Average Home Value in this Area
Purchase History
| Date | Buyer | Sale Price | Title Company |
|---|---|---|---|
| Preisser David J | $252,500 | Allegiance Title Company | |
| Michaelson Craig | $109,500 | Capitol Abstract | |
| Homesales Inc | -- | None Available | |
| Brown Marjorie L | $95,500 | Firstitle & Abstract Svcs In |
Source: Public Records
Mortgage History
| Date | Status | Borrower | Loan Amount |
|---|---|---|---|
| Previous Owner | Michaelson Craig | $103,950 | |
| Previous Owner | Brown Marjorie L | $94,951 |
Source: Public Records
Tax History Compared to Growth
Tax History
| Year | Tax Paid | Tax Assessment Tax Assessment Total Assessment is a certain percentage of the fair market value that is determined by local assessors to be the total taxable value of land and additions on the property. | Land | Improvement |
|---|---|---|---|---|
| 2024 | $3,036 | $27,674 | $2,638 | $25,036 |
| 2023 | $3,036 | $27,901 | $2,638 | $25,263 |
| 2022 | $1,739 | $15,298 | $2,476 | $12,822 |
| 2021 | $1,721 | $15,298 | $2,476 | $12,822 |
| 2020 | $1,834 | $16,298 | $2,638 | $13,660 |
| 2019 | $1,826 | $16,298 | $2,638 | $13,660 |
| 2018 | $1,768 | $16,298 | $2,638 | $13,660 |
| 2017 | $1,774 | $16,298 | $2,638 | $13,660 |
| 2016 | $1,736 | $15,887 | $2,571 | $13,316 |
| 2015 | $1,666 | $15,275 | $2,472 | $12,803 |
| 2014 | $1,601 | $14,410 | $2,332 | $12,078 |
Source: Public Records
Map
Nearby Homes
- 9306 E 114th St N
- 10318 E 116th Place N
- 8514 E 114th St N
- 9700 E 110th St N
- 8489 E 109th St N
- 8508 E 109th St N
- 0 E 116th St N Unit 2438747
- 10806 E 117th St N
- 10621 E 114th St N
- 10803 E 118th St N
- 10911 E 118th Ct N
- 8505 E 108th St N
- 8517 E 108th St N
- 8479 E 108th St N
- 10854 N 84th East Ave
- 11904 N 109th East Ave
- 10019 E 107th Place N
- 10702 N 100th East Ave
- 8323 E 111th St N
- 8453 E 111th St N
- 11442 N 96th East Ave
- 9611 E 115th St N
- 11439 N 96th East Ave
- 11438 N 96th East Ave
- 11433 N 96th East Ave
- 11425 N 96th East Ave
- 11421 N 96th East Ave
- 11420 N 96th East Ave
- 9444 E 116th St N
- 11413 N 96th East Ave
- 11616 N 97th East Ave
- 11414 N 96th East Ave
- 9411 E 114th St N
- 11407 N 96th East Ave
- 9419 E 114th St N
- 11406 N 96th East Ave
- 9727 E 116th St N
- 9427 E 114th St N
- 11410 N 94th East Ave
- 9320 E 116th St N