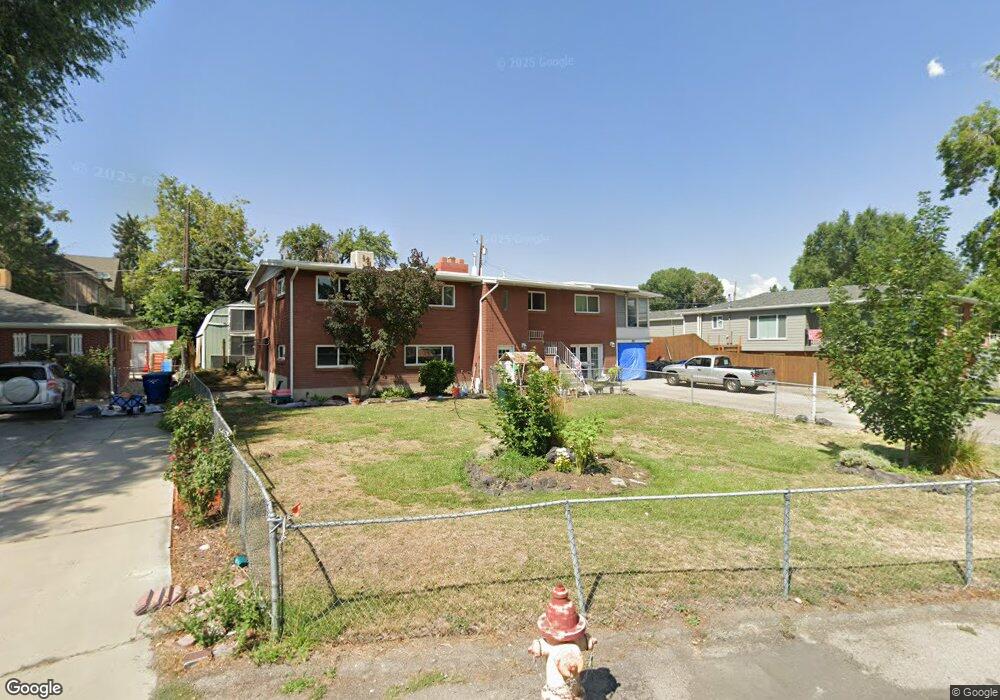
961 Hillview Dr Salt Lake City, UT 84124
Estimated Value: $631,000 - $697,000
5
Beds
2
Baths
1,535
Sq Ft
$434/Sq Ft
Est. Value
About This Home
This home is located at 961 Hillview Dr, Salt Lake City, UT 84124 and is currently estimated at $665,554, approximately $433 per square foot. 961 Hillview Dr is a home located in Salt Lake County with nearby schools including James E Moss Elementary School, Bonneville Junior High School, and Cottonwood High School.
Ownership History
Date
Name
Owned For
Owner Type
Purchase Details
Closed on
Jun 28, 2020
Sold by
Robison Daniel Dale and Robison Paula Glenda
Bought by
Robison Daniel D and Robison Paula Glenda
Current Estimated Value
Home Financials for this Owner
Home Financials are based on the most recent Mortgage that was taken out on this home.
Original Mortgage
$247,000
Interest Rate
3.2%
Mortgage Type
New Conventional
Purchase Details
Closed on
Dec 19, 2017
Sold by
Robison Daniel Dale
Bought by
Robison Daniel Dale and Robison Paula Glenda
Purchase Details
Closed on
Oct 24, 2007
Sold by
Robison Daniel D
Bought by
Robison Daniel Dale
Home Financials for this Owner
Home Financials are based on the most recent Mortgage that was taken out on this home.
Original Mortgage
$231,000
Interest Rate
6.3%
Mortgage Type
Stand Alone Refi Refinance Of Original Loan
Create a Home Valuation Report for This Property
The Home Valuation Report is an in-depth analysis detailing your home's value as well as a comparison with similar homes in the area
Home Values in the Area
Average Home Value in this Area
Purchase History
| Date | Buyer | Sale Price | Title Company |
|---|---|---|---|
| Robison Daniel D | -- | Paramount Title | |
| Robison Daniel Dale | -- | Accommodation | |
| Robison Daniel Dale | -- | First American Title Ut Co |
Source: Public Records
Mortgage History
| Date | Status | Borrower | Loan Amount |
|---|---|---|---|
| Closed | Robison Daniel D | $247,000 | |
| Closed | Robison Daniel Dale | $231,000 |
Source: Public Records
Tax History Compared to Growth
Tax History
| Year | Tax Paid | Tax Assessment Tax Assessment Total Assessment is a certain percentage of the fair market value that is determined by local assessors to be the total taxable value of land and additions on the property. | Land | Improvement |
|---|---|---|---|---|
| 2025 | $3,365 | $579,100 | $231,700 | $347,400 |
| 2024 | $3,365 | $538,800 | $224,500 | $314,300 |
| 2023 | $3,190 | $493,100 | $206,000 | $287,100 |
| 2022 | $2,925 | $454,400 | $202,000 | $252,400 |
| 2021 | $2,929 | $394,600 | $174,400 | $220,200 |
| 2020 | $2,817 | $358,200 | $156,100 | $202,100 |
| 2019 | $2,508 | $311,500 | $112,000 | $199,500 |
| 2018 | $2,361 | $282,400 | $112,000 | $170,400 |
| 2017 | $2,140 | $268,100 | $104,700 | $163,400 |
| 2016 | $1,990 | $251,700 | $104,700 | $147,000 |
| 2015 | $1,667 | $197,400 | $140,400 | $57,000 |
| 2014 | $1,589 | $184,000 | $137,700 | $46,300 |
Source: Public Records
Map
Nearby Homes
- 4059 S 1045 E
- 3944 S 900 E Unit 204
- 3944 S 900 E Unit 203
- 1077 E 4025 S
- 4356 S 900 E
- 830 E 3990 S Unit D
- 825 E 3990 S Unit C
- 3970 S 840 E Unit A
- 3965 S 805 E Unit B
- 832 E 4170 S
- 834 E 4170 S
- 779 E 4070 S
- 955 E Montana Vista Ln
- 3938 S 805 E Unit A
- 3924 S 805 E Unit B
- 883 E Arnecia Ct Unit 31
- 4194 S Carolyn St
- 4040 S 685 E Unit F
- 4040 S 685 E Unit F
- 657 E 4065 S Unit C
- 973 E Hillview Dr
- 973 Hillview Dr
- 955 Hillview Dr
- 991 Hillview Dr
- 960 Hillview Dr Unit 962
- 960 Hillview Dr Unit 2
- 960 E Hillview Dr
- 944 E Hillview Dr
- 944 Hillview Dr Unit 946
- 937 E Hillview Dr
- 982 E Hillview Dr
- 982 Hillview Dr
- 940 E Hillview Dr Unit Holladay Duplex for
- 940 E Hillview Dr
- 940 Hillview Dr
- 995 Hillview Dr
- 992 Hillview Dr
- 929 E Hillview Dr Unit A
- 929 E Hillview Dr
- 934 Hillview Dr Unit 936