Estimated Value: $270,000 - $281,000
3
Beds
2
Baths
1,317
Sq Ft
$208/Sq Ft
Est. Value
About This Home
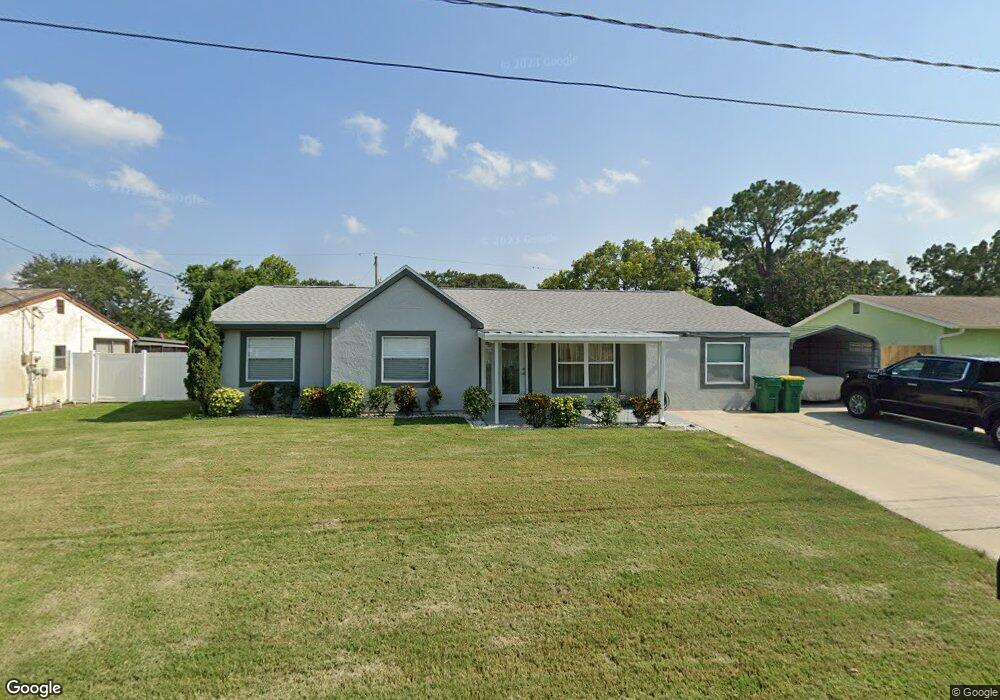
This home is located at 961 Palm St, Cocoa, FL 32927 and is currently estimated at $274,409, approximately $208 per square foot. 961 Palm St is a home located in Brevard County with nearby schools including Atlantis Elementary School, Space Coast Junior/Senior High School, and East Atlantic Prep of Brevard County.
Ownership History
Date
Name
Owned For
Owner Type
Purchase Details
Closed on
Jun 28, 2002
Sold by
Schecher Bernadette
Bought by
Morrell Anthony J
Current Estimated Value
Home Financials for this Owner
Home Financials are based on the most recent Mortgage that was taken out on this home.
Original Mortgage
$83,000
Outstanding Balance
$35,385
Interest Rate
6.79%
Mortgage Type
Purchase Money Mortgage
Estimated Equity
$239,024
Purchase Details
Closed on
Jul 29, 1999
Sold by
Hearn Richard L and Hearn Carol E
Bought by
Schecher Bernadette
Home Financials for this Owner
Home Financials are based on the most recent Mortgage that was taken out on this home.
Original Mortgage
$64,466
Interest Rate
7.66%
Purchase Details
Closed on
Mar 6, 1995
Sold by
Housing & Urban Dev
Bought by
Hearn Richard L and Hearn Carol E
Purchase Details
Closed on
Dec 28, 1994
Sold by
1St Tn Bk Natl Assn
Bought by
Housing & Urban Dev
Purchase Details
Closed on
Oct 26, 1994
Sold by
Clerk Circuit Court
Bought by
1St Tn Bk Natl Assn
Create a Home Valuation Report for This Property
The Home Valuation Report is an in-depth analysis detailing your home's value as well as a comparison with similar homes in the area
Home Values in the Area
Average Home Value in this Area
Purchase History
| Date | Buyer | Sale Price | Title Company |
|---|---|---|---|
| Morrell Anthony J | $83,000 | -- | |
| Schecher Bernadette | $64,500 | -- | |
| Hearn Richard L | $44,000 | -- | |
| Housing & Urban Dev | -- | -- | |
| 1St Tn Bk Natl Assn | -- | -- |
Source: Public Records
Mortgage History
| Date | Status | Borrower | Loan Amount |
|---|---|---|---|
| Open | Morrell Anthony J | $83,000 | |
| Previous Owner | Schecher Bernadette | $64,466 |
Source: Public Records
Tax History
| Year | Tax Paid | Tax Assessment Tax Assessment Total Assessment is a certain percentage of the fair market value that is determined by local assessors to be the total taxable value of land and additions on the property. | Land | Improvement |
|---|---|---|---|---|
| 2025 | $3,163 | $233,680 | -- | -- |
| 2024 | $3,067 | $236,500 | -- | -- |
| 2023 | $3,067 | $230,580 | $0 | $0 |
| 2022 | $2,690 | $206,180 | $0 | $0 |
| 2021 | $2,411 | $150,790 | $42,000 | $108,790 |
| 2020 | $2,239 | $138,150 | $40,000 | $98,150 |
| 2019 | $2,124 | $133,970 | $35,000 | $98,970 |
| 2018 | $2,016 | $122,270 | $27,000 | $95,270 |
| 2017 | $1,919 | $110,010 | $24,000 | $86,010 |
| 2016 | $1,789 | $92,860 | $18,000 | $74,860 |
| 2015 | $1,709 | $75,330 | $15,000 | $60,330 |
| 2014 | $1,575 | $68,490 | $11,000 | $57,490 |
Source: Public Records
Map
Nearby Homes
- 985 Tope St
- 7470 N Highway 1 Unit 101
- 7400 N Highway 1 Unit 105
- 7350 N Highway 1 Unit 201
- 7330 N Highway 1 Unit 206
- 7310 N Highway 1 Unit 201
- 7300 N Highway 1 Unit 104
- 873 Dunbar St
- 865 Dunbar St
- 0 Kanawha St
- 000 Arabella Ln
- 7240 N Highway 1 Unit 106
- 7170 N Highway 1 Unit 103
- 7160 N Highway 1 Unit 204
- 361 Payne Ave
- 977 Poinsetta St
- 1014 Illinois Rd
- 414 Oakridge Ave
- 1029 Illinois Rd
- 1040 Jersey St
Your Personal Tour Guide
Ask me questions while you tour the home.