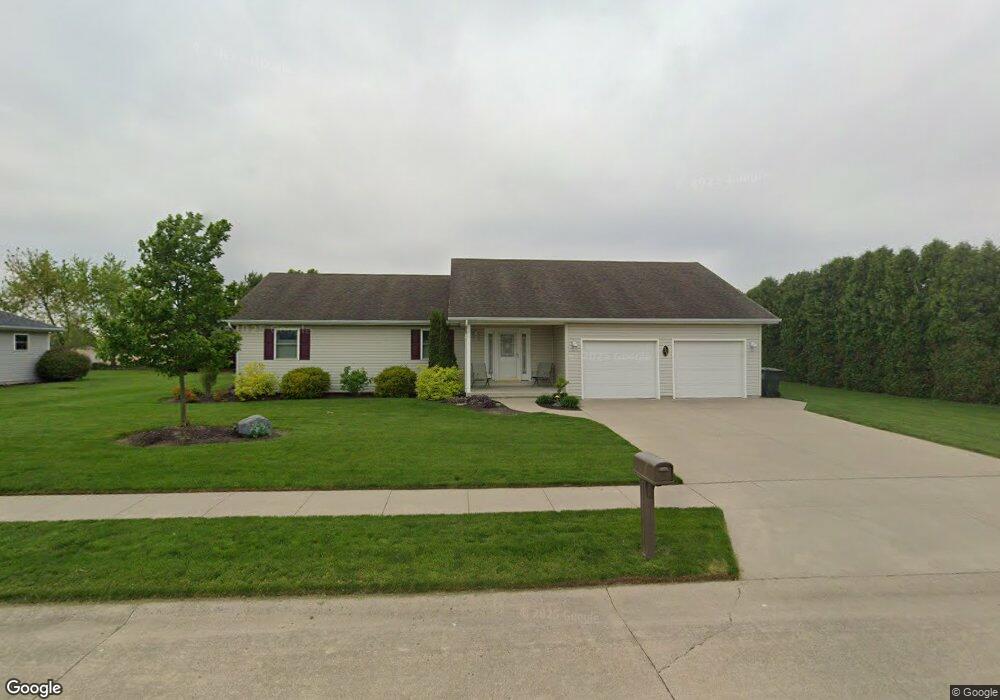
961 Southridge Dr Delphos, OH 45833
Estimated Value: $198,000 - $325,000
3
Beds
2
Baths
1,550
Sq Ft
$155/Sq Ft
Est. Value
About This Home
This home is located at 961 Southridge Dr, Delphos, OH 45833 and is currently estimated at $240,044, approximately $154 per square foot. 961 Southridge Dr is a home located in Van Wert County with nearby schools including Delphos St. John's High School and Delphos St. John's Elementary School.
Ownership History
Date
Name
Owned For
Owner Type
Purchase Details
Closed on
Dec 30, 2012
Bought by
Baum Lawrence E and Baum Laurie
Current Estimated Value
Purchase Details
Closed on
Aug 8, 2011
Sold by
Baum Lawrence E and Baum Laurie S
Bought by
Jurgens Allan J and Jurgens Nancy J
Home Financials for this Owner
Home Financials are based on the most recent Mortgage that was taken out on this home.
Original Mortgage
$112,000
Interest Rate
3.66%
Mortgage Type
New Conventional
Purchase Details
Closed on
Dec 21, 2005
Sold by
Relocation Properties Management Llc
Bought by
Baum Lawrence E and Baum Laurie S
Home Financials for this Owner
Home Financials are based on the most recent Mortgage that was taken out on this home.
Original Mortgage
$136,800
Interest Rate
6.48%
Mortgage Type
New Conventional
Purchase Details
Closed on
Apr 30, 2004
Bought by
Stutler Chad Erick
Create a Home Valuation Report for This Property
The Home Valuation Report is an in-depth analysis detailing your home's value as well as a comparison with similar homes in the area
Home Values in the Area
Average Home Value in this Area
Purchase History
| Date | Buyer | Sale Price | Title Company |
|---|---|---|---|
| Baum Lawrence E | $152,000 | -- | |
| Jurgens Allan J | $140,000 | First Lima Title Agency | |
| Baum Lawrence E | $76,000 | None Available | |
| Stutler Chad Erick | $161,000 | -- |
Source: Public Records
Mortgage History
| Date | Status | Borrower | Loan Amount |
|---|---|---|---|
| Previous Owner | Jurgens Allan J | $112,000 | |
| Previous Owner | Baum Lawrence E | $136,800 |
Source: Public Records
Tax History Compared to Growth
Tax History
| Year | Tax Paid | Tax Assessment Tax Assessment Total Assessment is a certain percentage of the fair market value that is determined by local assessors to be the total taxable value of land and additions on the property. | Land | Improvement |
|---|---|---|---|---|
| 2024 | $1,775 | $63,190 | $7,700 | $55,490 |
| 2023 | $1,775 | $63,190 | $7,700 | $55,490 |
| 2022 | $1,596 | $51,950 | $4,660 | $47,290 |
| 2021 | $1,601 | $51,950 | $4,660 | $47,290 |
| 2020 | $1,644 | $51,950 | $4,660 | $47,290 |
| 2019 | $1,321 | $46,220 | $4,660 | $41,560 |
| 2018 | $1,326 | $46,220 | $4,660 | $41,560 |
| 2017 | $1,331 | $46,220 | $4,660 | $41,560 |
| 2016 | $1,250 | $44,010 | $4,660 | $39,350 |
| 2015 | $1,250 | $38,600 | $4,660 | $33,940 |
| 2014 | $1,150 | $38,600 | $4,660 | $33,940 |
| 2013 | $1,226 | $38,600 | $4,660 | $33,940 |
Source: Public Records
Map
Nearby Homes
- 227 W Clime St Unit 10
- 634 S Clay St
- 827 S Washington St
- 606 S Cass St
- 1001 S Adams St
- 508 S Washington St
- 424 S Canal St
- 221 S Main St
- 11630 Clearview Dr
- 409 N Bredeick St
- 210 E 3rd St
- 616 W 5th St
- 503 W 6th St
- 405 N Franklin St
- 604 W 6th St
- 633 E 2nd St
- 610 N Washington St
- 821 E 3rd St
- 628 N Pierce St
- 704 N Franklin St