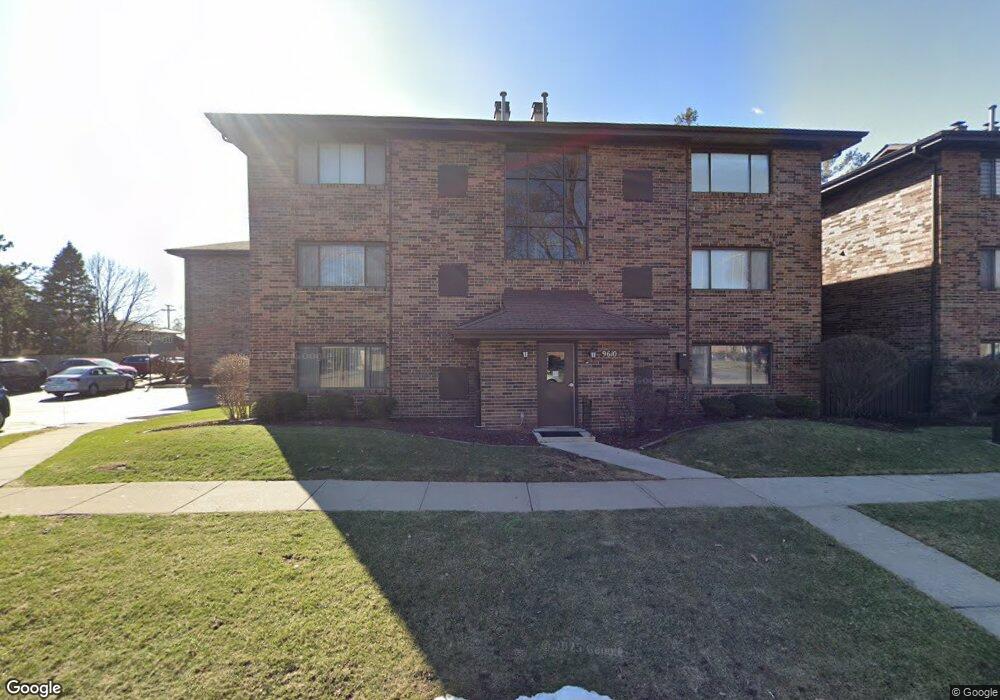
9610 Mason Ave Unit 13108 Oak Lawn, IL 60453
Estimated Value: $117,622 - $192,000
--
Bed
--
Bath
70
Sq Ft
$2,302/Sq Ft
Est. Value
About This Home
This home is located at 9610 Mason Ave Unit 13108, Oak Lawn, IL 60453 and is currently estimated at $161,156, approximately $2,302 per square foot. 9610 Mason Ave Unit 13108 is a home located in Cook County with nearby schools including Columbus Manor Elementary School, Simmons Middle School, and Oak Lawn Community High School.
Ownership History
Date
Name
Owned For
Owner Type
Purchase Details
Closed on
May 9, 2024
Sold by
Egan Robert J
Bought by
Garbaczewski Angenene
Current Estimated Value
Purchase Details
Closed on
Jul 16, 2019
Sold by
Z Financial Illinois G Properties Llc
Bought by
Egan Robert
Purchase Details
Closed on
Mar 11, 2014
Sold by
County Of Cook
Bought by
Z Financial Illinois G Properties Llc
Purchase Details
Closed on
Apr 26, 2005
Sold by
Baboo Santosh and Baboo George Jessie
Bought by
Andersen Frances
Purchase Details
Closed on
Sep 28, 2001
Sold by
Smolinskas Andrius and Smolinskas Iolanta
Bought by
Baboo Santosh and Baboo George Jessie
Home Financials for this Owner
Home Financials are based on the most recent Mortgage that was taken out on this home.
Original Mortgage
$97,500
Interest Rate
6.92%
Create a Home Valuation Report for This Property
The Home Valuation Report is an in-depth analysis detailing your home's value as well as a comparison with similar homes in the area
Home Values in the Area
Average Home Value in this Area
Purchase History
| Date | Buyer | Sale Price | Title Company |
|---|---|---|---|
| Garbaczewski Angenene | $115,000 | Chicago Title | |
| Egan Robert | $14,500 | None Available | |
| Z Financial Illinois G Properties Llc | -- | None Available | |
| Andersen Frances | -- | -- | |
| Baboo Santosh | $112,500 | Professional National Title |
Source: Public Records
Mortgage History
| Date | Status | Borrower | Loan Amount |
|---|---|---|---|
| Previous Owner | Baboo Santosh | $97,500 |
Source: Public Records
Tax History Compared to Growth
Tax History
| Year | Tax Paid | Tax Assessment Tax Assessment Total Assessment is a certain percentage of the fair market value that is determined by local assessors to be the total taxable value of land and additions on the property. | Land | Improvement |
|---|---|---|---|---|
| 2024 | $329 | $1,133 | $85 | $1,048 |
| 2023 | $195 | $1,133 | $85 | $1,048 |
| 2022 | $195 | $557 | $119 | $438 |
| 2021 | $189 | $556 | $118 | $438 |
| 2020 | $185 | $556 | $118 | $438 |
| 2019 | $192 | $591 | $107 | $484 |
| 2018 | $184 | $591 | $107 | $484 |
| 2017 | $186 | $591 | $107 | $484 |
| 2016 | $171 | $509 | $88 | $421 |
| 2015 | $170 | $509 | $88 | $421 |
| 2014 | $168 | $509 | $88 | $421 |
| 2013 | $214 | $710 | $88 | $622 |
Source: Public Records
Map
Nearby Homes
- 9609 S Austin Ave Unit 1E
- 9545 Southwest Hwy Unit 5
- 9540 S Mayfield Ave Unit 103S
- 9520 S Mayfield Ave Unit N105
- 5810 W 97th St
- 9714 Mcvicker Ave
- 9814 Austin Ave
- 9420 Massasoit Ave
- 6120 W 98th St
- 9542 Parkside Ave
- 10440 S Mayfield Ave Unit 1A
- 9258 Austin Ave
- 9611 Merton Ave
- 9600 Central Ave
- 9827 Melvina Ave
- 9729 Merton Ave
- 6237 W 94th St Unit 3S
- 9912 Austin Ave
- 9607 Marion Ave
- 9422 Central Ave
- 9610 Mason Ave Unit 13011
- 9610 Mason Ave Unit 13128
- 9610 Mason Ave Unit 13014
- 9610 Mason Ave Unit 13015
- 9610 Mason Ave Unit 13013
- 9610 Mason Ave Unit 13012
- 9610 Mason Ave Unit 13016
- 9610 Mason Ave Unit 3S
- 9610 Mason Ave Unit 3
- 9610 Mason Ave Unit 3N
- 9609 Austin Ave Unit 13035
- 9609 Austin Ave Unit 13118
- 9609 Austin Ave Unit 13033
- 9609 Austin Ave Unit 13031
- 9609 Austin Ave Unit 13034
- 9609 Austin Ave Unit 13032
- 9609 Austin Ave Unit 13036
- 9609 Austin Ave Unit 13117
- 9609 Austin Ave Unit 6
- 9609 Austin Ave