Estimated Value: $955,000 - $1,281,000
2
Beds
2
Baths
1,486
Sq Ft
$734/Sq Ft
Est. Value
About This Home
This home is located at 9611 S Kraxberger Rd, Canby, OR 97013 and is currently estimated at $1,090,257, approximately $733 per square foot. 9611 S Kraxberger Rd is a home located in Clackamas County with nearby schools including Josefa L. Sambrano Elementary School, Philander Lee Elementary School, and Baker Prairie Middle School.
Ownership History
Date
Name
Owned For
Owner Type
Purchase Details
Closed on
Sep 26, 2017
Sold by
Ross Gregory T and Ross Dawn E
Bought by
Ross Gregory T and Ross Dawn E
Current Estimated Value
Purchase Details
Closed on
Jun 11, 2012
Sold by
Pitre Dana
Bought by
Ross Gregory T and Ross Dawn E
Home Financials for this Owner
Home Financials are based on the most recent Mortgage that was taken out on this home.
Original Mortgage
$311,200
Outstanding Balance
$214,499
Interest Rate
3.79%
Mortgage Type
New Conventional
Estimated Equity
$875,758
Purchase Details
Closed on
Dec 17, 2003
Sold by
Clark Lloyd M and Clark Martin L
Bought by
Seim Marc and Pitre Dana
Home Financials for this Owner
Home Financials are based on the most recent Mortgage that was taken out on this home.
Original Mortgage
$292,000
Interest Rate
5.97%
Mortgage Type
Balloon
Create a Home Valuation Report for This Property
The Home Valuation Report is an in-depth analysis detailing your home's value as well as a comparison with similar homes in the area
Home Values in the Area
Average Home Value in this Area
Purchase History
| Date | Buyer | Sale Price | Title Company |
|---|---|---|---|
| Ross Gregory T | -- | None Available | |
| Ross Gregory T | $389,000 | First American | |
| Seim Marc | $365,000 | Chicago Title Insurance Comp |
Source: Public Records
Mortgage History
| Date | Status | Borrower | Loan Amount |
|---|---|---|---|
| Open | Ross Gregory T | $311,200 | |
| Previous Owner | Seim Marc | $292,000 | |
| Closed | Seim Marc | $54,750 |
Source: Public Records
Tax History Compared to Growth
Tax History
| Year | Tax Paid | Tax Assessment Tax Assessment Total Assessment is a certain percentage of the fair market value that is determined by local assessors to be the total taxable value of land and additions on the property. | Land | Improvement |
|---|---|---|---|---|
| 2025 | $5,100 | $356,386 | -- | -- |
| 2024 | $4,960 | $346,130 | -- | -- |
| 2023 | $4,960 | $336,177 | $0 | $0 |
| 2022 | $4,539 | $326,512 | $0 | $0 |
| 2021 | $4,364 | $317,127 | $0 | $0 |
| 2020 | $4,299 | $308,013 | $0 | $0 |
| 2019 | $4,076 | $299,163 | $0 | $0 |
| 2018 | $3,994 | $290,570 | $0 | $0 |
| 2017 | $3,898 | $282,225 | $0 | $0 |
| 2016 | $4,686 | $341,118 | $0 | $0 |
| 2015 | $1,977 | $144,862 | $0 | $0 |
| 2014 | $1,922 | $140,770 | $0 | $0 |
Source: Public Records
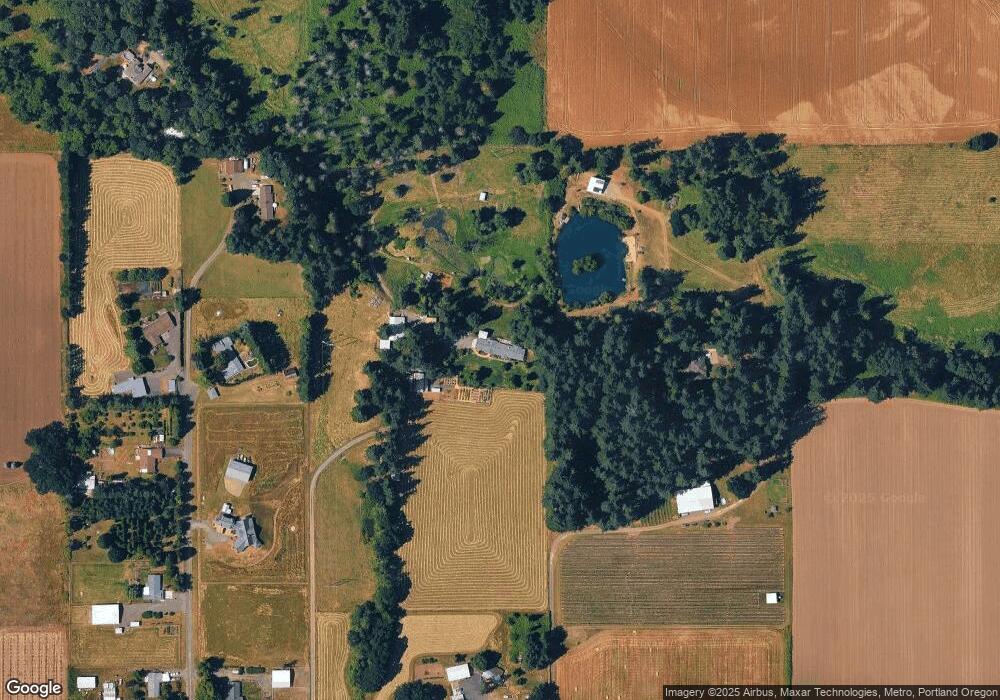
Map
Nearby Homes
- 1660 S Redwood St
- 1650 S Redwood St
- 1321 SE 17th Ave
- 1305 SE 17th Ave
- 1231 SE 18th Place
- 1220 SE 18th Place
- 1827 S Pepperwood St
- 1821 S Pepperwood St
- 1825 S Pepperwood St
- 1823 S Pepperwood St
- 1172 SE 18th Ave
- 1333 SE 14th Ave
- 1918 S Holly St
- 2211 SE 12th Ave
- 1357 SE 17th Ave
- 1143 SE 17th Ave
- 24843 S Blundell Rd
- 1157 SE 18th Ave
- 1146 SE 18th Ave
- 1175 SE 18th Ave
- 25820 S Linda Rd
- 25800 S Linda Rd
- 25815 S Linda Ln
- 25960 S Linda Ln
- 25905 S Linda Ln
- 25905 S Linda Rd
- 9709 S Kraxberger Rd
- 9510 S Alder Creek Ln
- 9685 S Kraxberger Rd
- 25995 S Linda Rd
- 25990 S Linda Ln
- 26131 S Linda Ln
- 9724 S Alder Creek Ln
- 26107 S Linda Ln
- 9536 S Alder Creek Ln
- 9414 S Alder Creek Ln
- 9785 S Kraxberger Rd
- 10001 S Kraxberger Rd
- 9466 S Alder Creek Ln
- 9760 S Alder Creek Ln