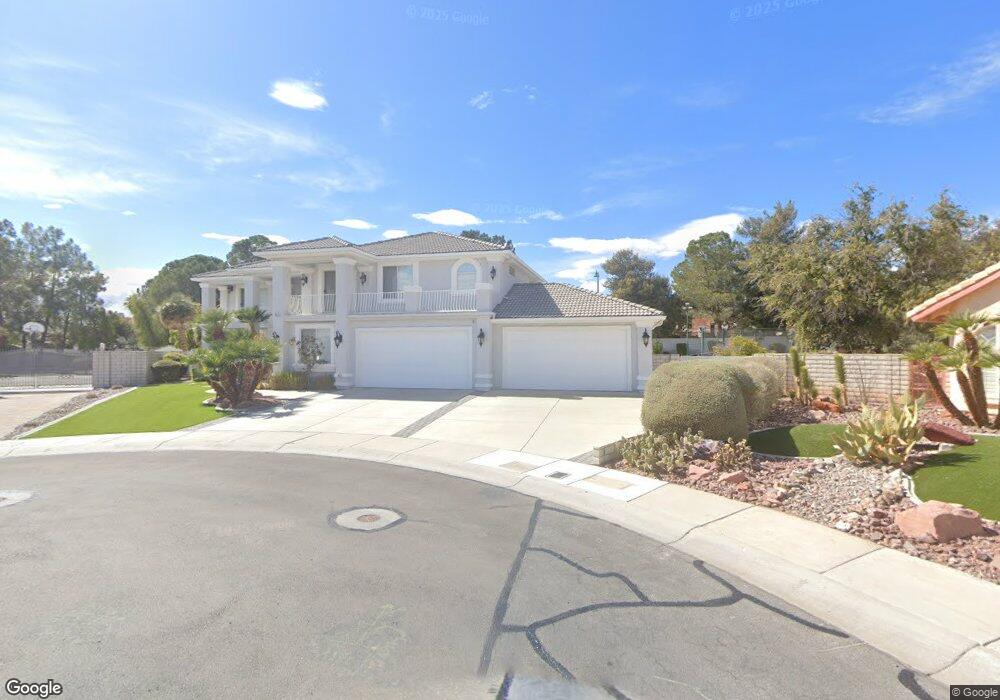
9616 Hawksbill Ct Las Vegas, NV 89117
The Section Seven NeighborhoodEstimated Value: $892,000 - $1,100,346
6
Beds
5
Baths
4,847
Sq Ft
$202/Sq Ft
Est. Value
About This Home
This home is located at 9616 Hawksbill Ct, Las Vegas, NV 89117 and is currently estimated at $980,587, approximately $202 per square foot. 9616 Hawksbill Ct is a home located in Clark County with nearby schools including M J Christensen Elementary School, Clifford J Lawrence Junior High School, and Bonanza High School.
Ownership History
Date
Name
Owned For
Owner Type
Purchase Details
Closed on
Oct 28, 2022
Sold by
Bradd J Robison Trust
Bought by
Mary K Robison Trust
Current Estimated Value
Purchase Details
Closed on
Sep 20, 1996
Sold by
Robison Bradd J and Robison Mary K
Bought by
Robison Bradd J and Robison Mary K
Purchase Details
Closed on
Apr 29, 1994
Sold by
Bruce Graves Development Corp
Bought by
Robison Bradd J and Robison Mary K
Home Financials for this Owner
Home Financials are based on the most recent Mortgage that was taken out on this home.
Original Mortgage
$303,250
Interest Rate
7.79%
Purchase Details
Closed on
Apr 26, 1994
Sold by
Collins & Graves Construction Corp
Bought by
Bruce Graves Development Corp
Home Financials for this Owner
Home Financials are based on the most recent Mortgage that was taken out on this home.
Original Mortgage
$303,250
Interest Rate
7.79%
Create a Home Valuation Report for This Property
The Home Valuation Report is an in-depth analysis detailing your home's value as well as a comparison with similar homes in the area
Home Values in the Area
Average Home Value in this Area
Purchase History
| Date | Buyer | Sale Price | Title Company |
|---|---|---|---|
| Mary K Robison Trust | -- | -- | |
| Robison Bradd J | -- | -- | |
| Robison Bradd J | $343,000 | National Title Company | |
| Bruce Graves Development Corp | $100,000 | National Title Company |
Source: Public Records
Mortgage History
| Date | Status | Borrower | Loan Amount |
|---|---|---|---|
| Previous Owner | Robison Bradd J | $303,250 |
Source: Public Records
Tax History Compared to Growth
Tax History
| Year | Tax Paid | Tax Assessment Tax Assessment Total Assessment is a certain percentage of the fair market value that is determined by local assessors to be the total taxable value of land and additions on the property. | Land | Improvement |
|---|---|---|---|---|
| 2025 | $5,138 | $241,662 | $83,545 | $158,117 |
| 2024 | $4,989 | $241,662 | $83,545 | $158,117 |
| 2023 | $4,989 | $219,483 | $68,530 | $150,953 |
| 2022 | $4,844 | $199,299 | $61,215 | $138,084 |
| 2021 | $4,703 | $183,002 | $50,820 | $132,182 |
| 2020 | $4,563 | $179,806 | $48,510 | $131,296 |
| 2019 | $4,430 | $172,408 | $42,350 | $130,058 |
| 2018 | $4,301 | $168,688 | $43,890 | $124,798 |
| 2017 | $5,380 | $164,093 | $37,345 | $126,748 |
| 2016 | $4,071 | $155,328 | $26,180 | $129,148 |
| 2015 | $4,064 | $133,326 | $26,180 | $107,146 |
| 2014 | $3,946 | $116,773 | $15,400 | $101,373 |
Source: Public Records
Map
Nearby Homes
- 9724 Cascade Falls Ave
- 9713 Cascade Falls Ave
- 9708 Blazing Star Ct
- 3001 Bridge Creek St
- 2728 Monrovia Dr
- 9544 Lazy River Dr
- 2724 Monrovia Dr
- 9605 Blowing Sand Cir
- 9624 Beach Water Cir
- 9717 Sierra Mesa Ave
- 9612 Chianti Ln
- 9548 Wooden Pier Way
- 9429 Abalone Way
- 2821 Willow Wind Ct
- 9504 Cliff View Way
- 2701 Purtell Cir
- 3009 Periscope Ct
- 2909 Ivory Reef Ct
- 3213 Shallow Point Cir
- 2913 Domino Way
- 9612 Hawksbill Ct
- 9613 Hawksbill Ct
- 9701 Stellar View Ave
- 9608 Hawksbill Ct Unit 3
- 9609 Hawksbill Ct
- 2916 Mellow Breeze St
- 2924 Hampton Bluff St
- 9613 Runaway Ct
- 9705 Stellar View Ave
- 2912 Mellow Breeze St
- 9612 Bottle Creek Ln
- 9609 Runaway Ct
- 2928 Hampton Bluff St
- 9605 Hawksbill Ct
- 9604 Hawksbill Ct
- 2908 Mellow Breeze St
- 9709 Stellar View Ave
- 2932 Hampton Bluff St
- 2904 Mellow Breeze St
- 9604 Bottle Creek Ln Unit 3