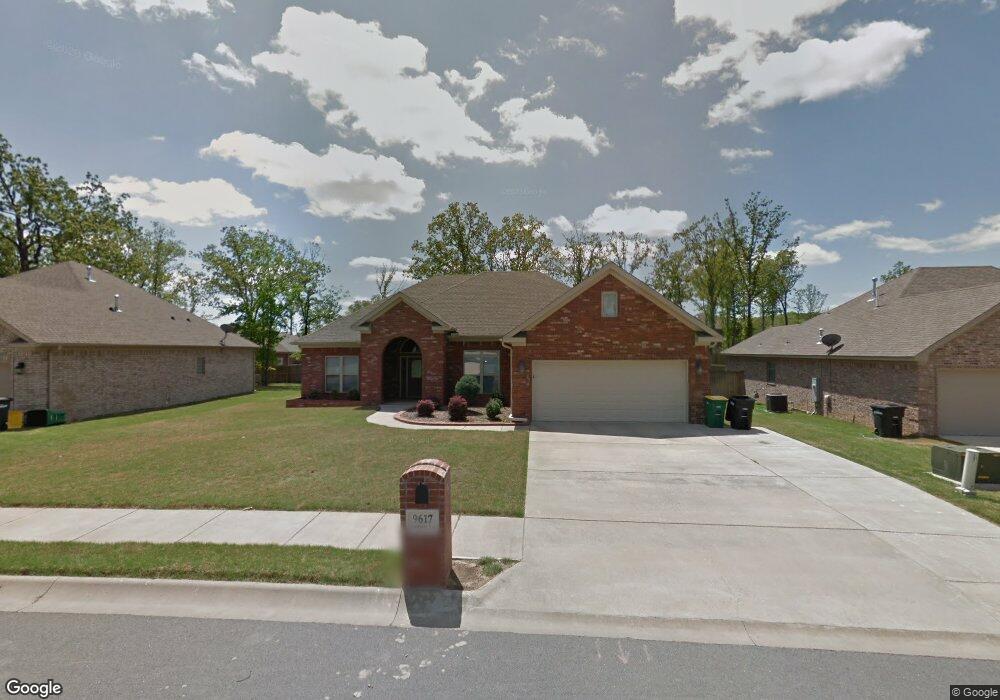
9617 Canterra Ln Sherwood, AR 72120
Estimated Value: $318,000 - $337,000
--
Bed
2
Baths
2,069
Sq Ft
$158/Sq Ft
Est. Value
About This Home
This home is located at 9617 Canterra Ln, Sherwood, AR 72120 and is currently estimated at $327,643, approximately $158 per square foot. 9617 Canterra Ln is a home located in Pulaski County with nearby schools including Sylvan Hills Elementary School, Sylvan Hills Middle School, and Sylvan Hills High School.
Ownership History
Date
Name
Owned For
Owner Type
Purchase Details
Closed on
Aug 5, 2019
Sold by
Louden Rebecca L
Bought by
Louden Anthony D
Current Estimated Value
Purchase Details
Closed on
Feb 19, 2010
Sold by
Scott Martin Construction Llc
Bought by
Louden Anthony and Louden Rebecca
Home Financials for this Owner
Home Financials are based on the most recent Mortgage that was taken out on this home.
Original Mortgage
$210,123
Outstanding Balance
$137,948
Interest Rate
4.87%
Mortgage Type
FHA
Estimated Equity
$189,695
Purchase Details
Closed on
Aug 28, 2009
Sold by
Sherwood Development Llc
Bought by
Scott Martin Construction Llc
Home Financials for this Owner
Home Financials are based on the most recent Mortgage that was taken out on this home.
Original Mortgage
$168,000
Interest Rate
5.2%
Mortgage Type
Construction
Create a Home Valuation Report for This Property
The Home Valuation Report is an in-depth analysis detailing your home's value as well as a comparison with similar homes in the area
Home Values in the Area
Average Home Value in this Area
Purchase History
| Date | Buyer | Sale Price | Title Company |
|---|---|---|---|
| Louden Anthony D | -- | None Available | |
| Louden Anthony | $214,000 | None Available | |
| Scott Martin Construction Llc | $38,000 | None Available |
Source: Public Records
Mortgage History
| Date | Status | Borrower | Loan Amount |
|---|---|---|---|
| Open | Louden Anthony | $210,123 | |
| Previous Owner | Scott Martin Construction Llc | $168,000 |
Source: Public Records
Tax History Compared to Growth
Tax History
| Year | Tax Paid | Tax Assessment Tax Assessment Total Assessment is a certain percentage of the fair market value that is determined by local assessors to be the total taxable value of land and additions on the property. | Land | Improvement |
|---|---|---|---|---|
| 2025 | $2,820 | $54,123 | $6,600 | $47,523 |
| 2024 | $2,646 | $54,123 | $6,600 | $47,523 |
| 2023 | $2,646 | $54,123 | $6,600 | $47,523 |
| 2022 | $2,804 | $54,123 | $6,600 | $47,523 |
| 2021 | $2,622 | $46,160 | $6,700 | $39,460 |
| 2020 | $2,239 | $46,160 | $6,700 | $39,460 |
| 2019 | $2,239 | $46,160 | $6,700 | $39,460 |
| 2018 | $2,264 | $46,160 | $6,700 | $39,460 |
| 2017 | $2,264 | $46,160 | $6,700 | $39,460 |
| 2016 | $2,448 | $49,700 | $7,480 | $42,220 |
| 2015 | $2,359 | $49,698 | $7,480 | $42,218 |
| 2014 | $2,359 | $46,428 | $7,480 | $38,948 |
Source: Public Records
Map
Nearby Homes
- 2117 Ingleside Dr
- 2032 Miramonte Dr
- Lot 4 Johnson Dr
- 00 Johnson Dr
- Lot 2 Johnson Dr
- Lot 6 Johnson Dr
- Lot 5 Johnson Dr
- Lot 1 Johnson Dr
- 9716 Wild Mountain Dr
- 8909 Overcup Acres Cove
- 4 Property Package
- 597 Valley Oak Dr
- 564 Valley Oak Dr
- 8824 Ridgeview Cove
- 2949 Maelstrom Cir
- 3216 Clearwater Ct
- 9833 Oak Heights Dr
- 111 Pamela Ln
- 3032 Overcup Dr
- 109 Pamela Ln
- 9609 Canterra Ln
- 9625 Canterra Ln
- 0 Del Rey Ln Unit 16031818
- 0 Del Rey Ln Unit 20031598
- 9616 Del Rey Ln
- 2208 Ingleside Dr
- 2201 Miramonte Dr
- 9624 Del Rey Ln
- 9608 Del Rey Ln
- 9608 Canterra Ln
- 9608 Canterra Ln
- 9616 Canterra Ln
- 9600 Del Rey Ln
- 2216 Ingleside Dr
- 9600 Del Rey Ln
- 9600 Canterra Ln
- 9632 Del Rey Ln
- 2201 Ingleside Dr
- 2209 Ingleside Dr
- 2201 Ingleside Dr