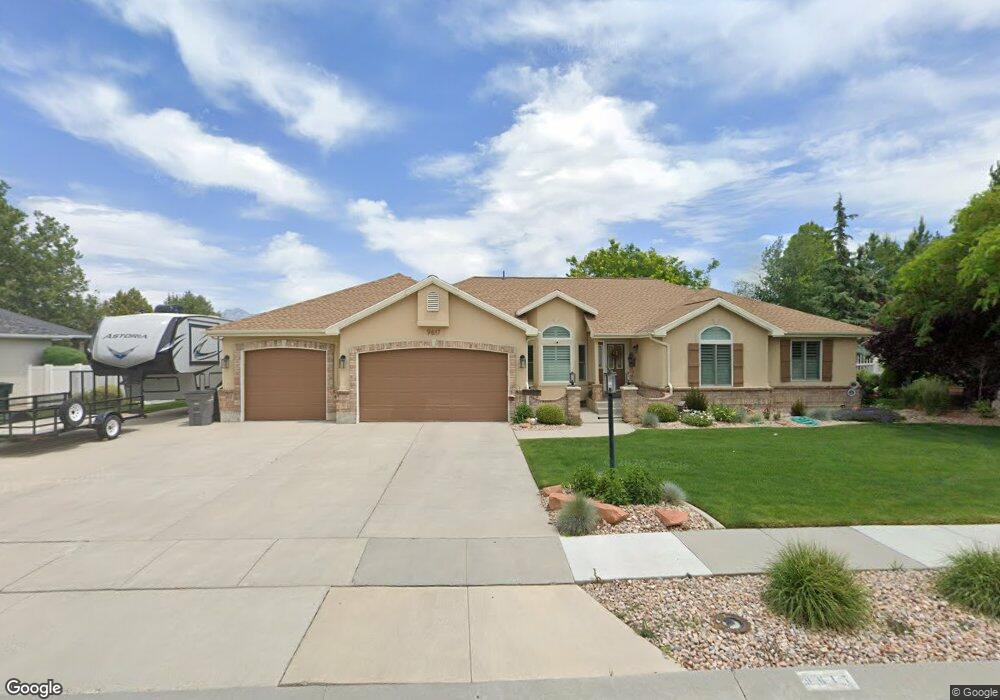
9617 Limestone Cir South Jordan, UT 84095
Estimated Value: $742,000 - $789,000
5
Beds
4
Baths
1,879
Sq Ft
$407/Sq Ft
Est. Value
About This Home
This home is located at 9617 Limestone Cir, South Jordan, UT 84095 and is currently estimated at $764,571, approximately $406 per square foot. 9617 Limestone Cir is a home located in Salt Lake County with nearby schools including Elk Meadows Elementary School, Elk Ridge Middle School, and Hawthorn Academy.
Ownership History
Date
Name
Owned For
Owner Type
Purchase Details
Closed on
Jan 24, 2003
Sold by
Roberts Faye and Roberts Scott D
Bought by
Roberts Faye and Roberts Scott D
Current Estimated Value
Home Financials for this Owner
Home Financials are based on the most recent Mortgage that was taken out on this home.
Original Mortgage
$47,299
Outstanding Balance
$20,105
Interest Rate
5.97%
Estimated Equity
$744,466
Purchase Details
Closed on
Mar 23, 1998
Sold by
Roberts Scott D and Roberts Faye
Bought by
Roberts Faye and Roberts Scott D
Purchase Details
Closed on
Dec 29, 1995
Sold by
Building Dynamics Inc
Bought by
Roberts Scott D and Roberts Faye
Home Financials for this Owner
Home Financials are based on the most recent Mortgage that was taken out on this home.
Original Mortgage
$50,950
Interest Rate
7.37%
Create a Home Valuation Report for This Property
The Home Valuation Report is an in-depth analysis detailing your home's value as well as a comparison with similar homes in the area
Home Values in the Area
Average Home Value in this Area
Purchase History
| Date | Buyer | Sale Price | Title Company |
|---|---|---|---|
| Roberts Faye | -- | Reliable Title | |
| Roberts Scott D | -- | Reliable Title | |
| Roberts Faye | -- | -- | |
| Roberts Scott D | -- | -- |
Source: Public Records
Mortgage History
| Date | Status | Borrower | Loan Amount |
|---|---|---|---|
| Open | Roberts Scott D | $47,299 | |
| Previous Owner | Roberts Scott D | $50,950 |
Source: Public Records
Tax History Compared to Growth
Tax History
| Year | Tax Paid | Tax Assessment Tax Assessment Total Assessment is a certain percentage of the fair market value that is determined by local assessors to be the total taxable value of land and additions on the property. | Land | Improvement |
|---|---|---|---|---|
| 2025 | -- | $729,100 | $199,800 | $529,300 |
| 2024 | -- | $669,900 | $185,400 | $484,500 |
| 2023 | $3,599 | $644,700 | $180,100 | $464,600 |
| 2022 | $0 | $659,900 | $176,600 | $483,300 |
| 2021 | $4,096 | $498,500 | $134,800 | $363,700 |
| 2020 | $3,014 | $455,200 | $130,500 | $324,700 |
| 2019 | $2,971 | $441,000 | $130,500 | $310,500 |
| 2018 | $0 | $414,000 | $130,500 | $283,500 |
| 2017 | $2,711 | $392,400 | $106,800 | $285,600 |
| 2016 | $2,754 | $377,800 | $106,800 | $271,000 |
| 2015 | $2,596 | $346,200 | $108,800 | $237,400 |
| 2014 | -- | $316,900 | $100,600 | $216,300 |
Source: Public Records
Map
Nearby Homes
- 3256 Star Fire Rd
- 9566 Ember Glow Ct Unit C
- 9526 Ember Glow Ct Unit C
- 9441 S Newkirk St
- 1967 W 9350 S
- 3702 W Angus Dr
- 2883 Jana Lee Dr
- 1578 W Banner Dr Unit 745
- 1558 W Banner Dr Unit 805
- 1574 W Banner Dr Unit 743
- 1556 W Banner Dr Unit 806
- 1548 W Banner Dr Unit 809
- 1552 W Banner Dr Unit 807
- 1553 W Banner Dr Unit 844
- 9294 S 2700 W
- 10177 Statesman Place
- 3750 W Bingham Creek Dr
- 2551 W Winding Way
- 3908 W Graymalkin Cir
- 10252 S 3570 W
- 9601 S Limestone Cir
- 9601 Limestone Cir
- 9637 Limestone Cir
- 9637 S Limestone Cir
- 9618 Iron Gate Rd
- 9618 S Iron Gate Rd
- 9632 Iron Gate Rd
- 9618 Limestone Cir
- 9598 Iron Gate Rd
- 9618 S Limestone Cir
- 9602 Limestone Cir
- 9602 S Limestone Cir
- 9583 Limestone Cir
- 9646 Iron Gate Rd
- 9646 S Iron Gate Rd
- 9638 S Limestone Cir
- 9638 Limestone Cir
- 9586 Iron Gate Rd
- 9647 Limestone Cir
- 9584 Limestone Cir