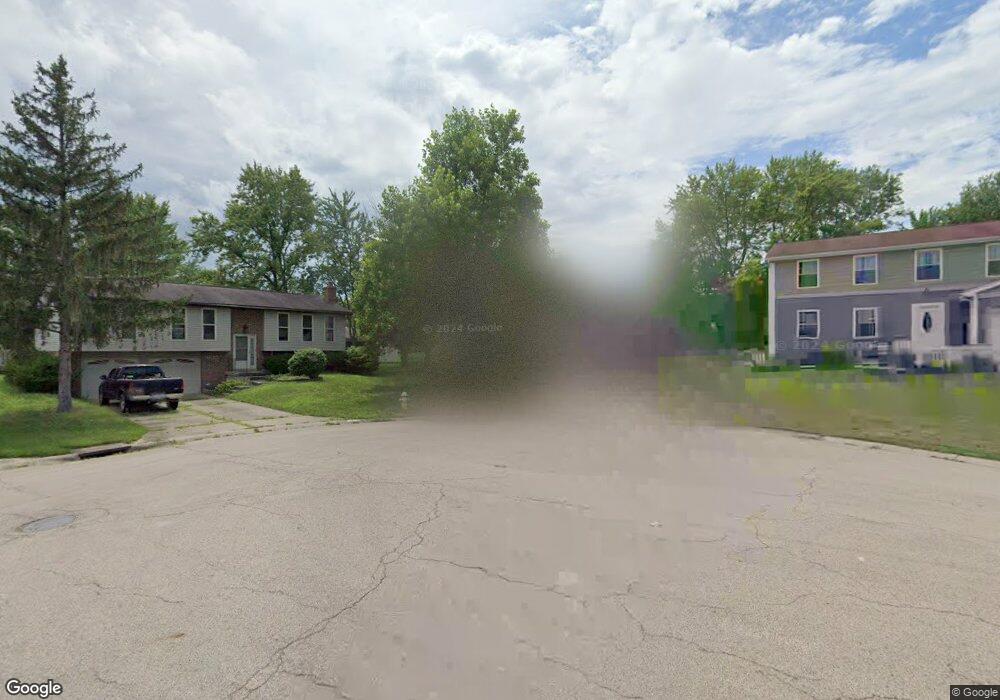
9617 Yorkridge Ct Miamisburg, OH 45342
Estimated Value: $182,000 - $221,000
3
Beds
2
Baths
1,425
Sq Ft
$144/Sq Ft
Est. Value
About This Home
This home is located at 9617 Yorkridge Ct, Miamisburg, OH 45342 and is currently estimated at $205,317, approximately $144 per square foot. 9617 Yorkridge Ct is a home located in Montgomery County with nearby schools including Miamisburg High School, Bishop Leibold School, and The CinDay Academy.
Ownership History
Date
Name
Owned For
Owner Type
Purchase Details
Closed on
Mar 29, 2024
Sold by
Moore Matthew M and Moore Alison J
Bought by
Moore Terry D
Current Estimated Value
Purchase Details
Closed on
Nov 29, 2016
Sold by
Brown Tina L
Bought by
Moore Matthew M and Moore Alison J
Home Financials for this Owner
Home Financials are based on the most recent Mortgage that was taken out on this home.
Original Mortgage
$93,575
Interest Rate
3.54%
Mortgage Type
Purchase Money Mortgage
Purchase Details
Closed on
May 26, 2005
Sold by
Byrd Jeremy L and Byrd Jill R
Bought by
Brown Maurice R and Brown Tina L
Purchase Details
Closed on
Dec 11, 1998
Sold by
Tran Mary T
Bought by
Byrd Jeremy L and Byrd Jill R
Home Financials for this Owner
Home Financials are based on the most recent Mortgage that was taken out on this home.
Original Mortgage
$99,460
Interest Rate
6.95%
Mortgage Type
FHA
Create a Home Valuation Report for This Property
The Home Valuation Report is an in-depth analysis detailing your home's value as well as a comparison with similar homes in the area
Home Values in the Area
Average Home Value in this Area
Purchase History
| Date | Buyer | Sale Price | Title Company |
|---|---|---|---|
| Moore Terry D | $205,500 | Home Services Title | |
| Moore Matthew M | $98,500 | Chicago Title Company Llc | |
| Brown Maurice R | $137,000 | -- | |
| Byrd Jeremy L | $100,000 | -- | |
| Byrd Jeremy L | $100,000 | -- |
Source: Public Records
Mortgage History
| Date | Status | Borrower | Loan Amount |
|---|---|---|---|
| Previous Owner | Moore Matthew M | $93,575 | |
| Previous Owner | Byrd Jeremy L | $99,460 |
Source: Public Records
Tax History Compared to Growth
Tax History
| Year | Tax Paid | Tax Assessment Tax Assessment Total Assessment is a certain percentage of the fair market value that is determined by local assessors to be the total taxable value of land and additions on the property. | Land | Improvement |
|---|---|---|---|---|
| 2024 | $3,248 | $46,450 | $11,460 | $34,990 |
| 2023 | $3,248 | $46,450 | $11,460 | $34,990 |
| 2022 | $3,007 | $35,460 | $8,750 | $26,710 |
| 2021 | $2,758 | $35,460 | $8,750 | $26,710 |
| 2020 | $2,754 | $35,460 | $8,750 | $26,710 |
| 2019 | $3,033 | $35,460 | $8,750 | $26,710 |
| 2018 | $3,012 | $35,460 | $8,750 | $26,710 |
| 2017 | $3,540 | $42,060 | $8,750 | $33,310 |
| 2016 | $3,135 | $35,630 | $8,750 | $26,880 |
| 2015 | $3,082 | $35,630 | $8,750 | $26,880 |
| 2014 | $3,082 | $35,630 | $8,750 | $26,880 |
| 2012 | -- | $37,310 | $11,550 | $25,760 |
Source: Public Records
Map
Nearby Homes
- 10001 Forestedge Ln
- 2540 Colinda Ct
- 9616 Wild Ginger Way
- 10123 Heartwood Ct
- 9528 Summer Wind Trail
- 2115 Autumn Haze Trail
- 2968 Asbury Ct
- 9607 Olde Georgetown
- 9747 Cobblewood Ct
- 9588 Tahoe Dr
- 9604 Tahoe Dr
- 9406 Tahoe Dr Unit 19406
- 2378 Ferndown Dr
- 1794 Placid Dr
- 9553 Tahoe Dr
- 1800 Olde Haley Dr
- 9540 Tahoe Dr
- 9519 Tahoe Dr
- 9515 Tahoe Dr
- 9764 Olde Georgetown Way
- 9609 Yorkridge Ct
- 9625 Yorkridge Ct
- 2675 Miami Village Dr
- 2665 Miami Village Dr
- 2460 Windsor Village Dr
- 2683 Miami Village Dr
- 2466 Windsor Village Dr
- 2655 Miami Village Dr
- 9601 Yorkridge Ct
- 2691 Miami Village Dr
- 9624 Yorkridge Ct
- 2645 Miami Village Dr
- 2701 Miami Village Dr
- 9608 Yorkridge Ct
- 2470 Windsor Village Dr
- 9616 Yorkridge Ct
- 9600 Yorkridge Ct
- 2637 Miami Village Dr
- 2356 Arrow Ridge Ct
- 2459 Windsor Village Dr