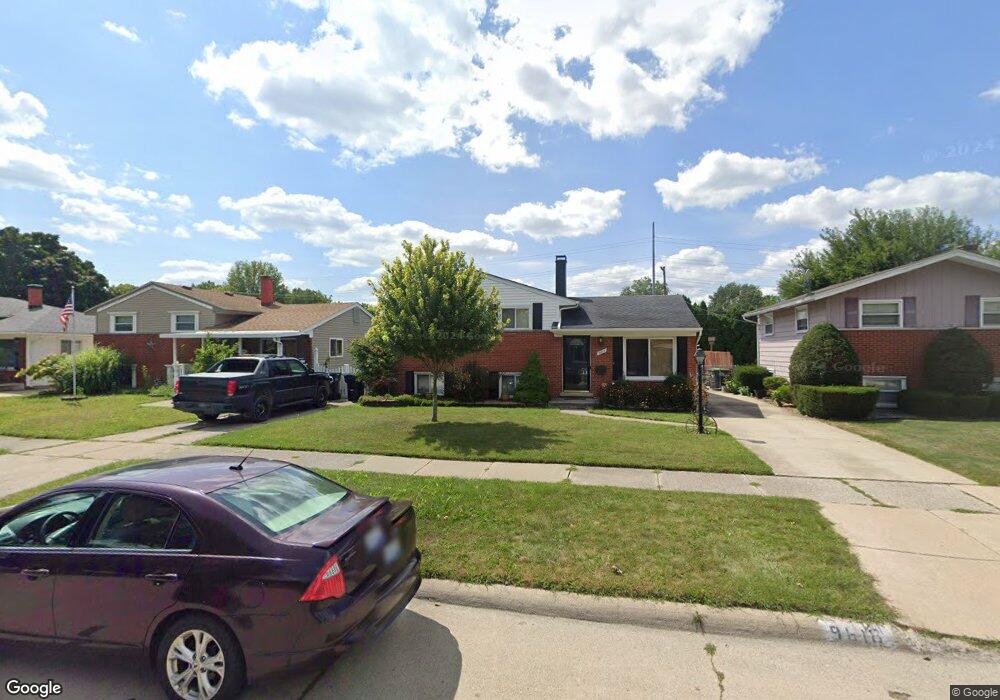
9618 Cass Ave Taylor, MI 48180
Estimated Value: $198,000 - $256,000
Studio
--
Bath
1,495
Sq Ft
$149/Sq Ft
Est. Value
About This Home
This home is located at 9618 Cass Ave, Taylor, MI 48180 and is currently estimated at $223,403, approximately $149 per square foot. 9618 Cass Ave is a home located in Wayne County with nearby schools including Kinyon Elementary School, Robert J. West Middle School, and Taylor High School.
Ownership History
Date
Name
Owned For
Owner Type
Purchase Details
Closed on
Aug 18, 2020
Sold by
Edwards Kristy L and Mabelintini Kristy L
Bought by
Edwards Kristy L
Current Estimated Value
Home Financials for this Owner
Home Financials are based on the most recent Mortgage that was taken out on this home.
Original Mortgage
$104,000
Outstanding Balance
$73,682
Interest Rate
2.9%
Mortgage Type
New Conventional
Estimated Equity
$149,721
Purchase Details
Closed on
Jul 18, 2007
Sold by
Mabelitini James E
Bought by
Mabelitini Kristy L
Purchase Details
Closed on
Jul 7, 2005
Sold by
Edwards Kristy L and Mabelitini Kristy L
Bought by
Mabelitini Kristy L
Home Financials for this Owner
Home Financials are based on the most recent Mortgage that was taken out on this home.
Original Mortgage
$130,000
Interest Rate
5.66%
Mortgage Type
New Conventional
Purchase Details
Closed on
May 18, 2001
Sold by
Property Solutions Group
Bought by
Edwards Kristy L
Purchase Details
Closed on
Feb 25, 1997
Sold by
Patrick J and Patrick Tracey L
Create a Home Valuation Report for This Property
The Home Valuation Report is an in-depth analysis detailing your home's value as well as a comparison with similar homes in the area
Home Values in the Area
Average Home Value in this Area
Purchase History
We collect this data history from publicly available records. To have your information removed, we recommend requesting removal directly through your county’s website.
| Date | Buyer | Sale Price | Title Company |
|---|---|---|---|
| Edwards Kristy L | -- | None Available | |
| Mabelitini Kristy L | -- | None Available | |
| Mabelitini Kristy L | -- | Complete Title Services Of S | |
| Edwards Kristy L | $126,500 | -- | |
| -- | $92,500 | -- |
Source: Public Records
Mortgage History
We collect this data history from publicly available records. To have your information removed, we recommend requesting removal directly through your county’s website.
| Date | Status | Borrower | Loan Amount |
|---|---|---|---|
| Open | Edwards Kristy L | $104,000 | |
| Closed | Mabelitini Kristy L | $130,000 |
Source: Public Records
Tax History
| Year | Tax Paid | Tax Assessment Tax Assessment Total Assessment is a certain percentage of the fair market value that is determined by local assessors to be the total taxable value of land and additions on the property. | Land | Improvement |
|---|---|---|---|---|
| 2025 | $2,159 | $97,400 | $0 | $0 |
| 2024 | $2,091 | $90,700 | $0 | $0 |
| 2023 | $2,492 | $79,900 | $0 | $0 |
| 2022 | $1,995 | $70,400 | $0 | $0 |
| 2021 | $2,192 | $63,000 | $0 | $0 |
| 2020 | $2,170 | $55,700 | $0 | $0 |
| 2019 | $217,035 | $46,000 | $0 | $0 |
| 2018 | $1,713 | $44,700 | $0 | $0 |
| 2017 | $921 | $41,900 | $0 | $0 |
| 2016 | $2,113 | $40,700 | $0 | $0 |
| 2015 | $3,871 | $39,500 | $0 | $0 |
| 2013 | $3,850 | $40,100 | $0 | $0 |
| 2012 | $1,698 | $38,800 | $10,300 | $28,500 |
Source: Public Records
Map
Nearby Homes
- 9560 Sylvester St
- 9749 Sylvester St
- 23362 Baker St
- 23263 Pinewood Dr Unit 110
- 9167 Groschner St
- 22327 Wick Rd
- 22311 Wick Rd
- 9360 Pine St
- 23665 Baske St
- 9788 Pine St
- 22243 Kinyon St Unit 3
- 22243 Kinyon St Unit 1
- 011 Pine St
- 01 Pine St
- 9731 Cornell St
- 9615 Cornell St
- 9602 Cornell St
- 9606 Cornell St
- 9384 Elaine Ct
- 22134 Wick Rd
Your Personal Tour Guide
Ask me questions while you tour the home.