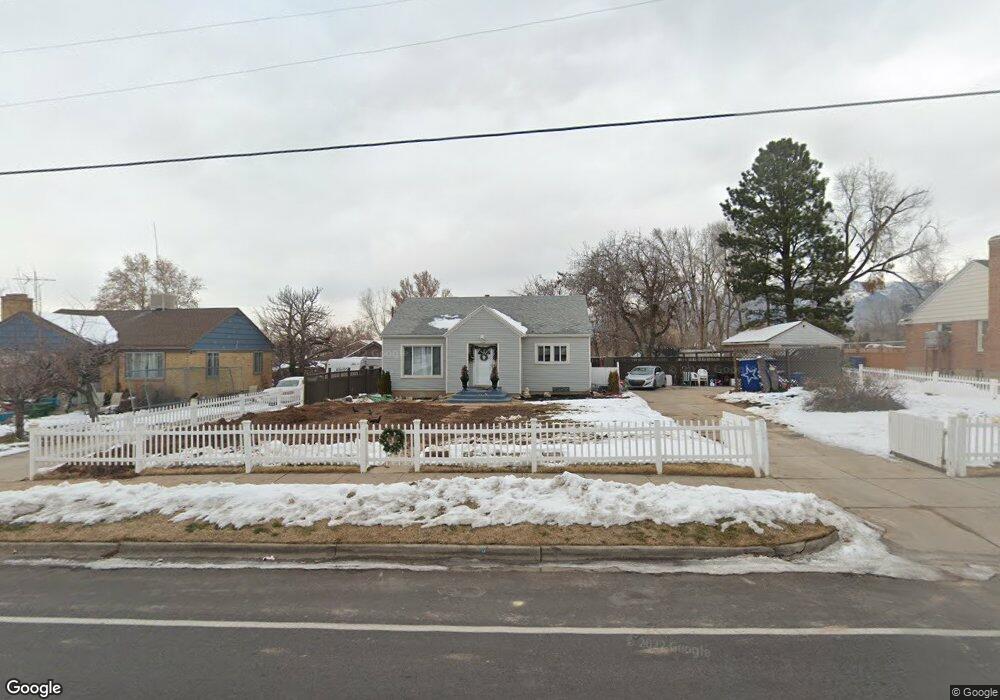
962 36th St Ogden, UT 84403
TO Smith NeighborhoodEstimated Value: $393,000 - $432,000
4
Beds
2
Baths
2,400
Sq Ft
$172/Sq Ft
Est. Value
About This Home
This home is located at 962 36th St, Ogden, UT 84403 and is currently estimated at $413,828, approximately $172 per square foot. 962 36th St is a home located in Weber County with nearby schools including Mount Ogden Junior High School, Ogden High School, and Guidepost Montessori at Ogden.
Ownership History
Date
Name
Owned For
Owner Type
Purchase Details
Closed on
Jun 19, 2018
Sold by
Bibandor Van Jovi
Bought by
Aguirre Braulio J Ceballos and Ceballos Nora Angelica
Current Estimated Value
Home Financials for this Owner
Home Financials are based on the most recent Mortgage that was taken out on this home.
Original Mortgage
$214,836
Outstanding Balance
$185,797
Interest Rate
4.5%
Mortgage Type
FHA
Estimated Equity
$228,031
Purchase Details
Closed on
Nov 6, 2006
Sold by
Neary Michael J and Neary Wendy M
Bought by
Youngblood Gail M
Home Financials for this Owner
Home Financials are based on the most recent Mortgage that was taken out on this home.
Original Mortgage
$96,387
Interest Rate
6.36%
Mortgage Type
FHA
Purchase Details
Closed on
Oct 17, 2003
Sold by
Wheeler Wendy M
Bought by
Neary Michael J and Neary Wendy M
Home Financials for this Owner
Home Financials are based on the most recent Mortgage that was taken out on this home.
Original Mortgage
$50,000
Interest Rate
6.4%
Mortgage Type
Purchase Money Mortgage
Create a Home Valuation Report for This Property
The Home Valuation Report is an in-depth analysis detailing your home's value as well as a comparison with similar homes in the area
Home Values in the Area
Average Home Value in this Area
Purchase History
| Date | Buyer | Sale Price | Title Company |
|---|---|---|---|
| Aguirre Braulio J Ceballos | -- | Us Title Insurance Agency | |
| Youngblood Gail M | -- | Mountain View Title | |
| Neary Michael J | -- | Mountain View Title |
Source: Public Records
Mortgage History
| Date | Status | Borrower | Loan Amount |
|---|---|---|---|
| Open | Aguirre Braulio J Ceballos | $214,836 | |
| Previous Owner | Youngblood Gail M | $96,387 | |
| Previous Owner | Neary Michael J | $50,000 |
Source: Public Records
Tax History
| Year | Tax Paid | Tax Assessment Tax Assessment Total Assessment is a certain percentage of the fair market value that is determined by local assessors to be the total taxable value of land and additions on the property. | Land | Improvement |
|---|---|---|---|---|
| 2025 | $3,061 | $391,487 | $105,802 | $285,685 |
| 2024 | $3,030 | $210,099 | $58,286 | $151,813 |
| 2023 | $2,892 | $202,950 | $52,769 | $150,181 |
| 2022 | $2,696 | $190,300 | $45,757 | $144,543 |
| 2021 | $2,344 | $270,000 | $52,784 | $217,216 |
| 2020 | $2,186 | $231,000 | $40,630 | $190,370 |
| 2019 | $2,065 | $203,000 | $34,540 | $168,460 |
| 2018 | $1,789 | $171,000 | $32,792 | $138,208 |
| 2017 | $1,781 | $159,000 | $34,451 | $124,549 |
| 2016 | $1,273 | $57,002 | $18,479 | $38,523 |
| 2015 | $1,390 | $62,650 | $18,479 | $44,171 |
| 2014 | $1,283 | $56,448 | $15,624 | $40,824 |
Source: Public Records
Map
Nearby Homes
- 1004 36th St
- 925 36th St
- 1066 35th St
- 3734 Jackson Ave
- 1616 S Fowler Ave
- 882 Franklin St
- 3476 Brinker Ave
- 848 Franklin St
- 3374 Eccles Ave
- 3813 Grandview Dr
- 1130 38th St
- 3828 Quincy Ave
- 4615 S Monroe Blvd
- 3572 S Madison Ave
- 743 37th St
- 3506 S Madison Ave
- 3856 Grandview Dr
- 3287 Van Buren Ave
- 904 39th St
- 3808 Raymond Ave
Your Personal Tour Guide
Ask me questions while you tour the home.