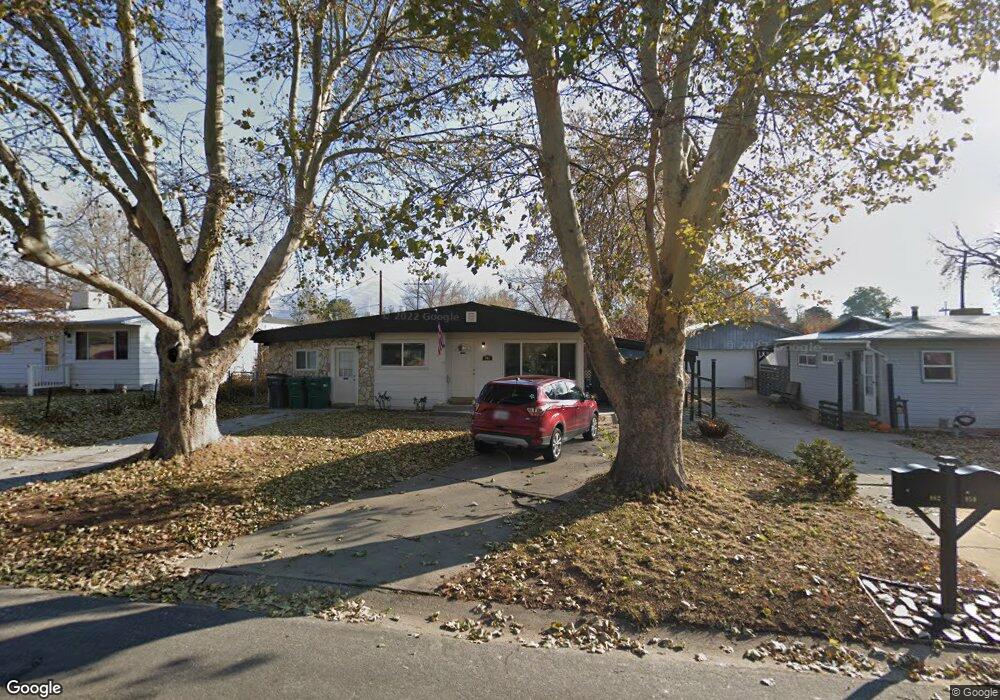
962 La Verde St Layton, UT 84041
Estimated Value: $337,000 - $369,000
3
Beds
1
Bath
1,032
Sq Ft
$343/Sq Ft
Est. Value
About This Home
This home is located at 962 La Verde St, Layton, UT 84041 and is currently estimated at $354,110, approximately $343 per square foot. 962 La Verde St is a home located in Davis County with nearby schools including Crestview Elementary School, Central Davis Junior High School, and Layton High School.
Ownership History
Date
Name
Owned For
Owner Type
Purchase Details
Closed on
Aug 5, 2022
Sold by
Dixon Donald S
Bought by
Sokol Coleton Wayne and Sokol Jessami
Current Estimated Value
Home Financials for this Owner
Home Financials are based on the most recent Mortgage that was taken out on this home.
Original Mortgage
$282,150
Outstanding Balance
$268,916
Interest Rate
5.3%
Mortgage Type
New Conventional
Estimated Equity
$85,194
Purchase Details
Closed on
Dec 26, 2017
Sold by
Canyon Advantage Llc
Bought by
Dixon Donald S
Home Financials for this Owner
Home Financials are based on the most recent Mortgage that was taken out on this home.
Original Mortgage
$171,690
Interest Rate
3.9%
Mortgage Type
New Conventional
Purchase Details
Closed on
Mar 29, 2017
Sold by
Etitle Insurance Agency
Bought by
Canyon Advantage Llc
Purchase Details
Closed on
Jan 12, 2005
Sold by
Byington Thayle L
Bought by
Byington Thayle L and Thayle L Byington Trust
Create a Home Valuation Report for This Property
The Home Valuation Report is an in-depth analysis detailing your home's value as well as a comparison with similar homes in the area
Home Values in the Area
Average Home Value in this Area
Purchase History
| Date | Buyer | Sale Price | Title Company |
|---|---|---|---|
| Sokol Coleton Wayne | -- | None Listed On Document | |
| Dixon Donald S | -- | Guarantee Title | |
| Canyon Advantage Llc | $123,100 | -- | |
| Byington Thayle L | -- | -- |
Source: Public Records
Mortgage History
| Date | Status | Borrower | Loan Amount |
|---|---|---|---|
| Open | Sokol Coleton Wayne | $282,150 | |
| Previous Owner | Dixon Donald S | $171,690 |
Source: Public Records
Tax History Compared to Growth
Tax History
| Year | Tax Paid | Tax Assessment Tax Assessment Total Assessment is a certain percentage of the fair market value that is determined by local assessors to be the total taxable value of land and additions on the property. | Land | Improvement |
|---|---|---|---|---|
| 2025 | $1,635 | $171,600 | $99,118 | $72,482 |
| 2024 | $1,597 | $168,850 | $115,664 | $53,186 |
| 2023 | $1,626 | $303,000 | $139,109 | $163,891 |
| 2022 | $1,663 | $168,300 | $73,071 | $95,229 |
| 2021 | $1,597 | $241,000 | $101,243 | $139,757 |
| 2020 | $1,443 | $209,000 | $85,715 | $123,285 |
| 2019 | $1,311 | $186,000 | $81,892 | $104,108 |
| 2018 | $1,166 | $166,000 | $81,892 | $84,108 |
| 2016 | $89 | $64,735 | $25,821 | $38,914 |
| 2015 | $884 | $61,655 | $25,821 | $35,834 |
| 2014 | $722 | $51,509 | $25,821 | $25,688 |
| 2013 | -- | $61,253 | $13,070 | $48,183 |
Source: Public Records
Map
Nearby Homes
- 972 La Verde St
- 950 La Verde St
- 192 W Gordon Ave
- 938 La Verde St
- 149 W Gordon Ave
- 969 Sapphire Dr
- 969 La Verde St
- 955 La Verde St
- 981 Sapphire Dr
- 957 Sapphire Dr
- 928 La Verde St
- 200 W Gordon Ave
- 121 W Gordon Ave
- 201 Barbara St
- 943 Sapphire Dr
- 943 Sapphire Dr
- 212 Barbara St
- 920 La Verde St
- 980 Sapphire Dr
- 212 W Gordon Ave