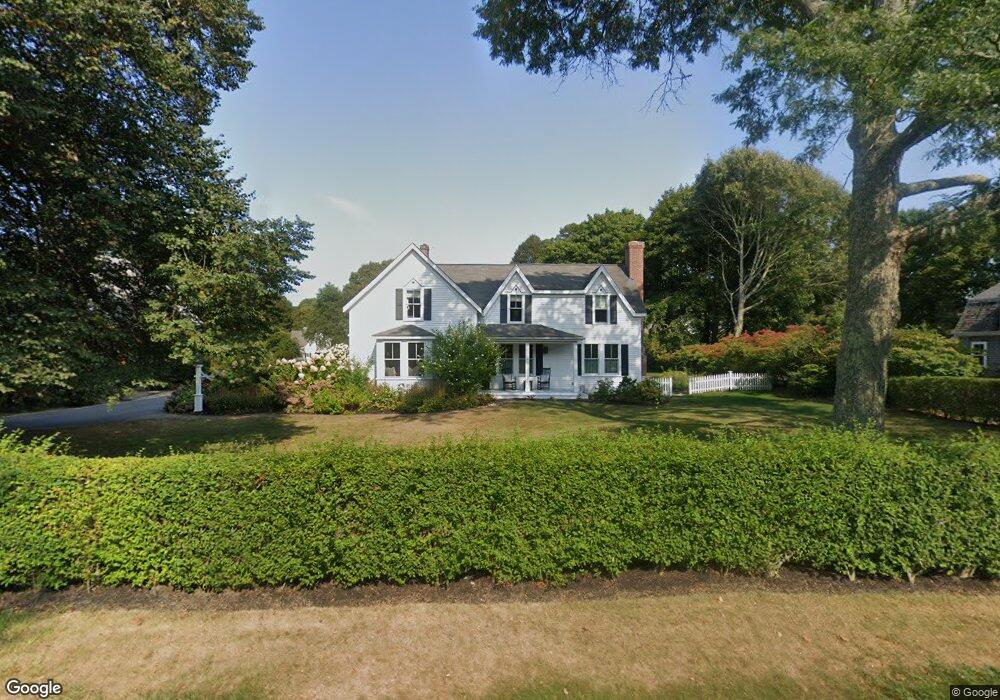
962 Main St Osterville, MA 02655
Osterville NeighborhoodEstimated Value: $1,211,000 - $1,655,000
3
Beds
2
Baths
1,501
Sq Ft
$941/Sq Ft
Est. Value
About This Home
This home is located at 962 Main St, Osterville, MA 02655 and is currently estimated at $1,412,371, approximately $940 per square foot. 962 Main St is a home located in Barnstable County with nearby schools including West Villages Elementary School, Barnstable United Elementary School, and Barnstable Intermediate School.
Ownership History
Date
Name
Owned For
Owner Type
Purchase Details
Closed on
Apr 15, 2021
Sold by
Lawler David V and Lawler Elizabeth A
Bought by
Lawler Ft
Current Estimated Value
Purchase Details
Closed on
Sep 30, 1999
Sold by
Chase Sarah L
Bought by
Lawler David
Purchase Details
Closed on
Mar 26, 1999
Sold by
Conway Jonathana and Conway Amy T
Bought by
Chase Sarah L
Purchase Details
Closed on
Jun 24, 1996
Sold by
Fitts Sheila A
Bought by
Conway Jonathan A
Create a Home Valuation Report for This Property
The Home Valuation Report is an in-depth analysis detailing your home's value as well as a comparison with similar homes in the area
Home Values in the Area
Average Home Value in this Area
Purchase History
| Date | Buyer | Sale Price | Title Company |
|---|---|---|---|
| Lawler Ft | -- | None Available | |
| Lawler David | $340,000 | -- | |
| Chase Sarah L | $300,170 | -- | |
| Conway Jonathan A | $142,000 | -- |
Source: Public Records
Mortgage History
| Date | Status | Borrower | Loan Amount |
|---|---|---|---|
| Previous Owner | Conway Jonathan A | $417,000 | |
| Previous Owner | Conway Jonathan A | $35,000 |
Source: Public Records
Tax History
| Year | Tax Paid | Tax Assessment Tax Assessment Total Assessment is a certain percentage of the fair market value that is determined by local assessors to be the total taxable value of land and additions on the property. | Land | Improvement |
|---|---|---|---|---|
| 2025 | $8,558 | $1,057,900 | $521,100 | $536,800 |
| 2024 | $8,279 | $1,060,000 | $521,100 | $538,900 |
| 2023 | $6,907 | $828,200 | $366,800 | $461,400 |
| 2022 | $6,719 | $697,000 | $311,300 | $385,700 |
| 2021 | $6,367 | $607,000 | $283,000 | $324,000 |
| 2020 | $6,346 | $579,000 | $283,000 | $296,000 |
| 2019 | $5,952 | $527,700 | $283,000 | $244,700 |
| 2018 | $5,860 | $522,300 | $309,800 | $212,500 |
| 2017 | $5,683 | $528,200 | $321,700 | $206,500 |
| 2016 | $5,679 | $521,000 | $314,500 | $206,500 |
| 2015 | $6,040 | $556,700 | $318,700 | $238,000 |
Source: Public Records
Map
Nearby Homes
- 39 Blossom Ave Unit 4
- 920 Main St Unit 1 Building 2
- 920 Main St Unit 2-1
- 67 Fire Station Rd
- 39 Tower Hill Rd Unit 1C
- 29 Oak Ridge Rd
- 33 Sunset Ln
- 40 Waterfield Rd
- 98 Bunker Hill Rd
- 77 Robbins St
- 146 Scudder Rd
- 117 Parsley Ln
- 369 Bumps River Rd
- 16 2nd Ave Unit 4
- 51 Wianno Cir
- 280 Ice Valley Rd
- 351 Swift Ave
- 89 Swift Ave
- 207 Crystal Lake Rd
- 71 Sand Point
- 972 Main St
- 950 Main St
- 972 Main (Ost )
- 980 Main St
- 980 Main St Unit 3
- 969 Main St
- 942 Main St
- 969 Main St
- 26 Blossom Ave
- 955 Main St
- 30 Blossom Ave
- 33 Emily Way
- 990 Main St
- 38 Blossom Ave Unit 38A
- 38 Blossom Ave
- 38 Blossom Ave Unit B
- 38 Blossom Ave Unit A&B
- 38 Blossom Ave Unit A
- 39 Blossom Ave Unit 6
- 39 Blossom Ave Unit 7
Your Personal Tour Guide
Ask me questions while you tour the home.