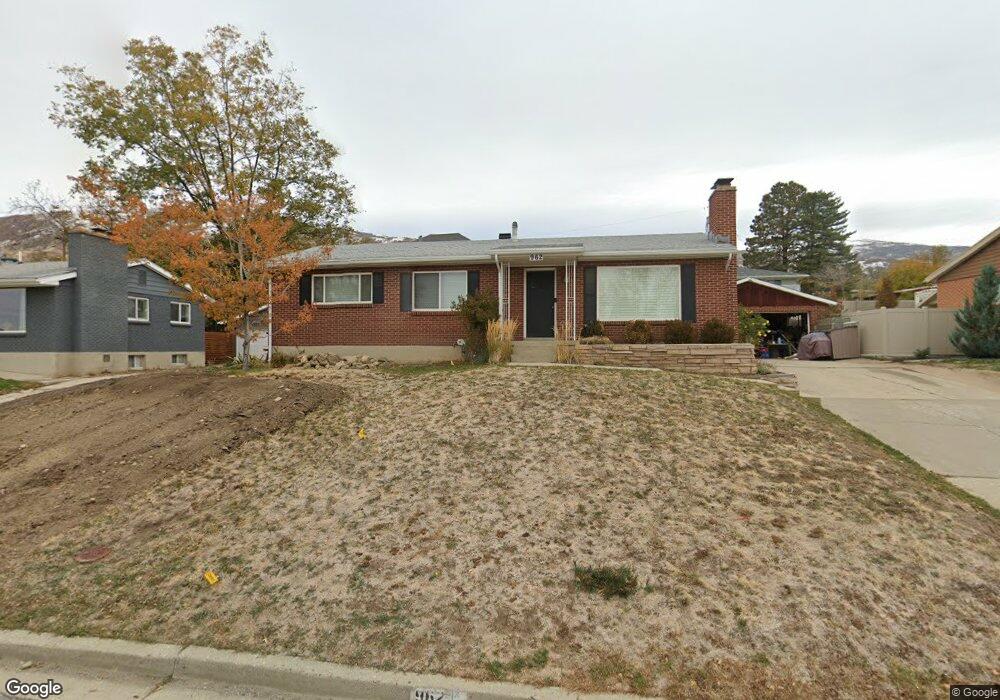
962 N 650 E Bountiful, UT 84010
Estimated Value: $540,230 - $627,000
3
Beds
2
Baths
2,304
Sq Ft
$246/Sq Ft
Est. Value
About This Home
This home is located at 962 N 650 E, Bountiful, UT 84010 and is currently estimated at $567,058, approximately $246 per square foot. 962 N 650 E is a home located in Davis County with nearby schools including Tolman School, Bountiful Junior High School, and Viewmont High School.
Ownership History
Date
Name
Owned For
Owner Type
Purchase Details
Closed on
Jul 1, 2021
Sold by
Farr Joshua J
Bought by
Farr Joshua
Current Estimated Value
Home Financials for this Owner
Home Financials are based on the most recent Mortgage that was taken out on this home.
Original Mortgage
$335,000
Outstanding Balance
$303,301
Interest Rate
2.9%
Mortgage Type
New Conventional
Estimated Equity
$263,757
Purchase Details
Closed on
Jun 6, 2017
Sold by
Black David R and Black Jaclyn M
Bought by
Farr Joshua J
Purchase Details
Closed on
Jul 22, 2013
Sold by
Wilson Lynette F
Bought by
Black David R and Black Jaclyn M
Home Financials for this Owner
Home Financials are based on the most recent Mortgage that was taken out on this home.
Original Mortgage
$193,200
Interest Rate
3.98%
Mortgage Type
New Conventional
Purchase Details
Closed on
Nov 3, 2009
Sold by
Wilson Lynette
Bought by
Wilson Lynette F
Create a Home Valuation Report for This Property
The Home Valuation Report is an in-depth analysis detailing your home's value as well as a comparison with similar homes in the area
Purchase History
| Date | Buyer | Sale Price | Title Company |
|---|---|---|---|
| Farr Joshua | -- | Stewart Title Ins Agency | |
| Farr Joshua J | -- | Pinnacle Title | |
| Black David R | -- | Paramount Title Cor | |
| Wilson Lynette F | -- | None Available |
Source: Public Records
Mortgage History
| Date | Status | Borrower | Loan Amount |
|---|---|---|---|
| Open | Farr Joshua | $335,000 | |
| Previous Owner | Black David R | $193,200 |
Source: Public Records
Tax History
| Year | Tax Paid | Tax Assessment Tax Assessment Total Assessment is a certain percentage of the fair market value that is determined by local assessors to be the total taxable value of land and additions on the property. | Land | Improvement |
|---|---|---|---|---|
| 2025 | $3,046 | $276,100 | $130,096 | $146,004 |
| 2024 | $2,865 | $269,500 | $120,006 | $149,494 |
| 2023 | $2,556 | $434,000 | $216,839 | $217,161 |
| 2022 | $2,703 | $252,450 | $115,360 | $137,090 |
| 2021 | $2,299 | $327,000 | $171,394 | $155,606 |
| 2020 | $2,030 | $289,000 | $156,080 | $132,920 |
| 2019 | $2,048 | $285,000 | $155,429 | $129,571 |
| 2018 | $1,903 | $260,000 | $144,156 | $115,844 |
| 2016 | $1,533 | $112,695 | $45,356 | $67,339 |
| 2015 | $1,527 | $106,095 | $45,356 | $60,739 |
| 2014 | $1,489 | $106,476 | $45,356 | $61,120 |
| 2013 | -- | $94,887 | $43,945 | $50,942 |
Source: Public Records
Map
Nearby Homes
- 662 E 1200 N
- 975 E 1050 N
- 1023 E 800 N
- 453 N 400 E Unit 7-D
- 610 E Pages Ln
- 908 Northern Hills Dr Unit 3
- 1105 E 600 N
- 345 N 400 E
- 933 Northern Hills Cir
- 683 E 100 N
- 1420 N Main St
- 967 S Courtyard Ln
- 1342 Northridge Dr
- 49 E 200 N Unit 4
- 610 S 800 E
- 41 E 200 N Unit 6
- 55 E 200 N Unit 2
- 51 E 200 N Unit 3
- 256 N Main St
- 254 N Main St
Your Personal Tour Guide
Ask me questions while you tour the home.