
Seller's Agent in 2025
Michael Olszewski
Area Wide Realty
(708) 220-1791
1 in this area
573 Total Sales
Estimated Value: $169,000 - $195,803
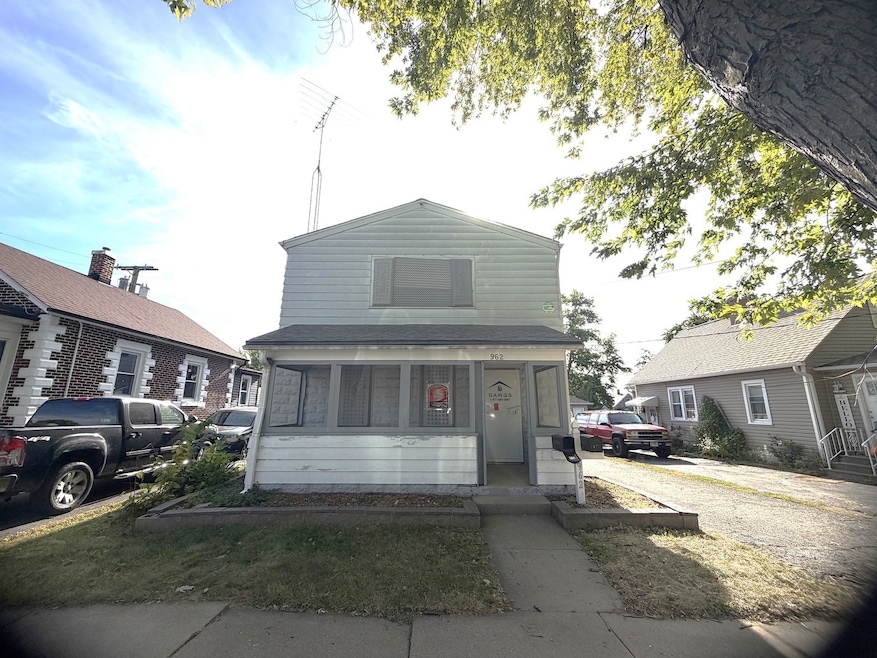
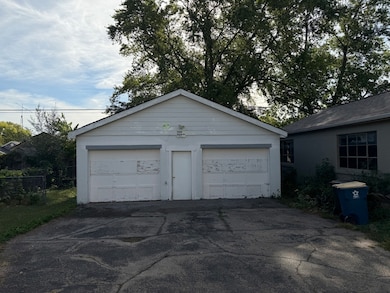
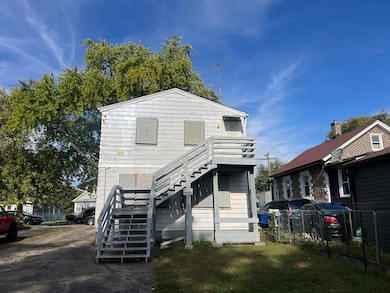
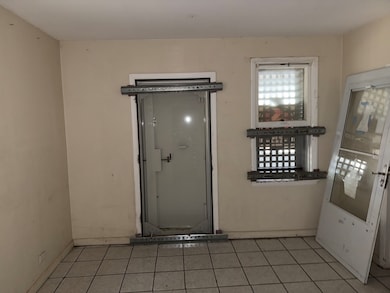
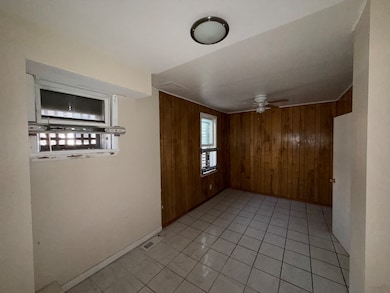
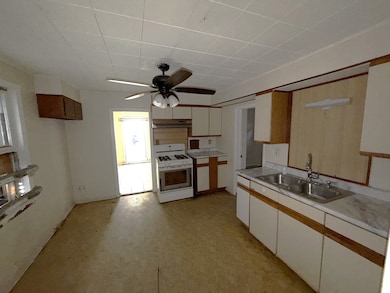
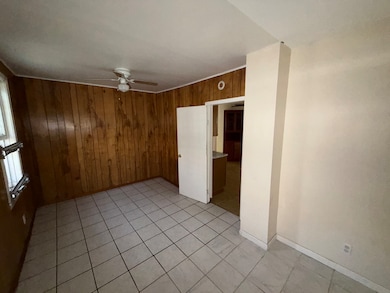
Excellent investment opportunity in Aurora. This home features 4-bedrooms, 2 bathrooms and a 2 car detached garage. Property includes a full basement for added storage or expansion possibilities. Property requires work and is being sold in AS IS condition, no surveys nor disclosures, taxes prorated. Room sizes are estimates. With some updates, this property has excellent long-term value. Per the City of Aurora the property needs to be used as a Single Family Dwelling, not a 2 Unit. (See Attached from City of Aurora)
Last Agent to Sell the Property
Area Wide Realty License #471011979 Listed on: 10/31/2025
| Date | Buyer | Sale Price | Title Company |
|---|---|---|---|
| Huitron Atzimba | $170,000 | Chicago Title | |
| Us Bank National Association | -- | None Listed On Document | |
| Hernandez Hermeneglido | $180,000 | Saturn Title Llc | |
| Fernandez Lucy Castill | $59,000 | Citywide Title Corp | |
| Hernandez Dolores | $148,000 | -- |
| Date | Status | Borrower | Loan Amount |
|---|---|---|---|
| Previous Owner | Hernandez Hermeneglido | $176,739 | |
| Previous Owner | Hernandez Dolores | $145,900 |
| Date | Event | Price | List to Sale | Price per Sq Ft |
|---|---|---|---|---|
| 12/19/2025 12/19/25 | Sold | $170,000 | -5.6% | $94 / Sq Ft |
| 11/21/2025 11/21/25 | Pending | -- | -- | -- |
| 10/31/2025 10/31/25 | For Sale | $180,000 | -- | $100 / Sq Ft |
| Year | Tax Paid | Tax Assessment Tax Assessment Total Assessment is a certain percentage of the fair market value that is determined by local assessors to be the total taxable value of land and additions on the property. | Land | Improvement |
|---|---|---|---|---|
| 2024 | $4,530 | $65,205 | $5,393 | $59,812 |
| 2023 | $4,305 | $58,261 | $4,819 | $53,442 |
| 2022 | $3,999 | $51,178 | $4,397 | $46,781 |
| 2021 | $4,353 | $47,648 | $4,094 | $43,554 |
| 2020 | $4,143 | $44,258 | $3,803 | $40,455 |
| 2019 | $4,010 | $41,007 | $3,524 | $37,483 |
| 2018 | $3,539 | $35,454 | $3,260 | $32,194 |
| 2017 | $3,138 | $30,486 | $3,004 | $27,482 |
| 2016 | $3,016 | $28,394 | $3,029 | $25,365 |
| 2015 | -- | $25,390 | $2,605 | $22,785 |
| 2014 | -- | $25,220 | $2,394 | $22,826 |
| 2013 | -- | $25,690 | $2,288 | $23,402 |
Seller's Agent in 2025
Michael Olszewski
Area Wide Realty
(708) 220-1791
1 in this area
573 Total Sales
Buyer's Agent in 2025
Luis Torres
OnPath Realty Inc.
(630) 777-4597
1 in this area
33 Total Sales
Source: Midwest Real Estate Data (MRED)
MLS Number: 12508512
APN: 15-28-378-020
Disclaimer: Certain information contained herein is derived from information provided by parties other than Homes.com. All information provided is deemed reliable, but is not guaranteed to be accurate and should be independently verified.
![]() Based on information submitted to the MLS GRID. All data is obtained from various sources and may not have been verified by broker or MLS GRID. Supplied Open House Information is subject to change without notice. All information should be independently reviewed and verified for accuracy. Properties may or may not be listed by the office/agent presenting the information. Some IDX listings have been excluded from this website.
Based on information submitted to the MLS GRID. All data is obtained from various sources and may not have been verified by broker or MLS GRID. Supplied Open House Information is subject to change without notice. All information should be independently reviewed and verified for accuracy. Properties may or may not be listed by the office/agent presenting the information. Some IDX listings have been excluded from this website.
Based on information submitted to the MLS GRID
Ask me questions while you tour the home.