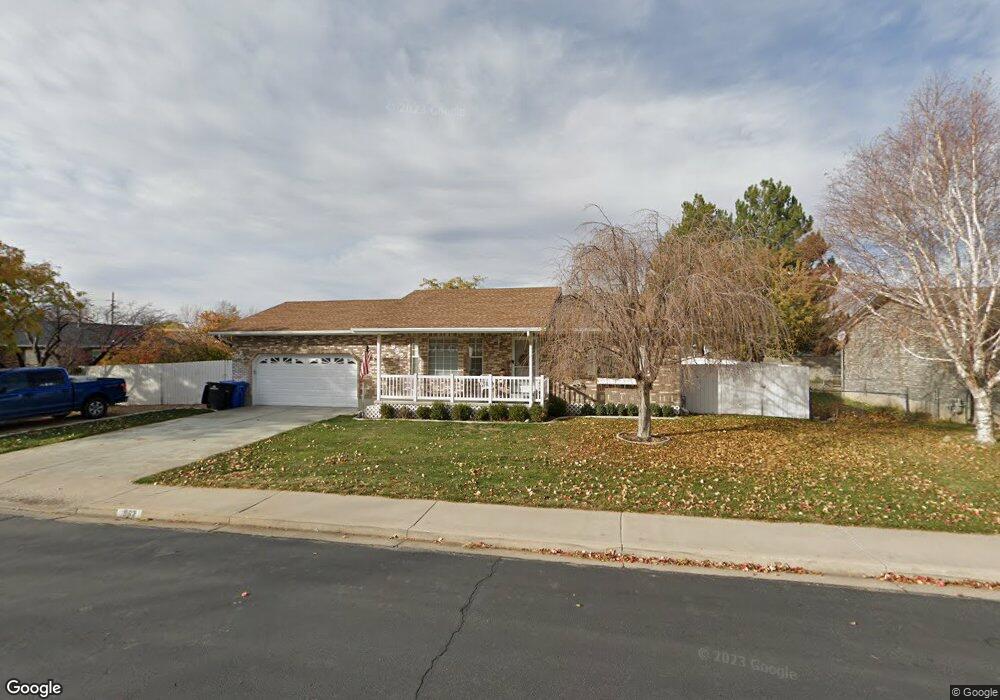
962 S 1170 E Spanish Fork, UT 84660
Estimated Value: $539,000 - $635,000
3
Beds
3
Baths
2,122
Sq Ft
$276/Sq Ft
Est. Value
About This Home
This home is located at 962 S 1170 E, Spanish Fork, UT 84660 and is currently estimated at $585,469, approximately $275 per square foot. 962 S 1170 E is a home located in Utah County with nearby schools including Canyon Elementary School, Spanish Fork Jr High School, and Spanish Fork High School.
Ownership History
Date
Name
Owned For
Owner Type
Purchase Details
Closed on
Aug 18, 2017
Sold by
Bradley Hugh and Bradley Helene A
Bought by
Richter John and Richter Gwendolyn
Current Estimated Value
Home Financials for this Owner
Home Financials are based on the most recent Mortgage that was taken out on this home.
Original Mortgage
$263,415
Outstanding Balance
$218,216
Interest Rate
3.96%
Estimated Equity
$367,253
Purchase Details
Closed on
Jul 22, 2011
Sold by
Patten Diane and Bradford Diane
Bought by
Bradley Hugh and Bradley Helene A
Home Financials for this Owner
Home Financials are based on the most recent Mortgage that was taken out on this home.
Original Mortgage
$85,500
Interest Rate
4.45%
Create a Home Valuation Report for This Property
The Home Valuation Report is an in-depth analysis detailing your home's value as well as a comparison with similar homes in the area
Home Values in the Area
Average Home Value in this Area
Purchase History
| Date | Buyer | Sale Price | Title Company |
|---|---|---|---|
| Richter John | -- | Fidelity Land & Title | |
| Bradley Hugh | -- | American Preferred Title |
Source: Public Records
Mortgage History
| Date | Status | Borrower | Loan Amount |
|---|---|---|---|
| Open | Richter John | $263,415 | |
| Previous Owner | Bradley Hugh | $85,500 |
Source: Public Records
Tax History
| Year | Tax Paid | Tax Assessment Tax Assessment Total Assessment is a certain percentage of the fair market value that is determined by local assessors to be the total taxable value of land and additions on the property. | Land | Improvement |
|---|---|---|---|---|
| 2025 | $2,291 | $317,735 | -- | -- |
| 2024 | $2,316 | $236,170 | $0 | $0 |
| 2023 | $2,263 | $238,975 | $0 | $0 |
| 2022 | $2,263 | $229,075 | $0 | $0 |
| 2021 | $1,899 | $307,500 | $114,500 | $193,000 |
| 2020 | $1,797 | $282,800 | $104,100 | $178,700 |
| 2019 | $1,618 | $267,900 | $89,200 | $178,700 |
| 2018 | $1,482 | $237,200 | $81,800 | $155,400 |
| 2017 | $1,363 | $117,260 | $0 | $0 |
| 2016 | $1,218 | $103,400 | $0 | $0 |
| 2015 | $1,175 | $98,560 | $0 | $0 |
| 2014 | $1,069 | $89,980 | $0 | $0 |
Source: Public Records
Map
Nearby Homes
- 834 S 1300 #16gc E
- 816 S 1300 #15gc E
- 857 S 1300 E Unit 32
- 857 S 1300 E
- 815 S 1300 E Unit 34
- 789 S 1300 E
- 762 S 1360 E
- 762 S 1360 E Unit 25
- 232 E 860 S Unit 158
- 1105 S 200 E
- 2256 E 760 S Unit 7
- 2308 E 850 South St Unit 10
- 715 Scenic Dr
- 993 S 1660 E
- 1687 E 1000 S
- 1147 S 1660 E
- 1330 E 410 S
- 938 S 1740 E
- 2998 Canyon Dr Unit 333
- 3014 Canyon Dr Unit 332
Your Personal Tour Guide
Ask me questions while you tour the home.