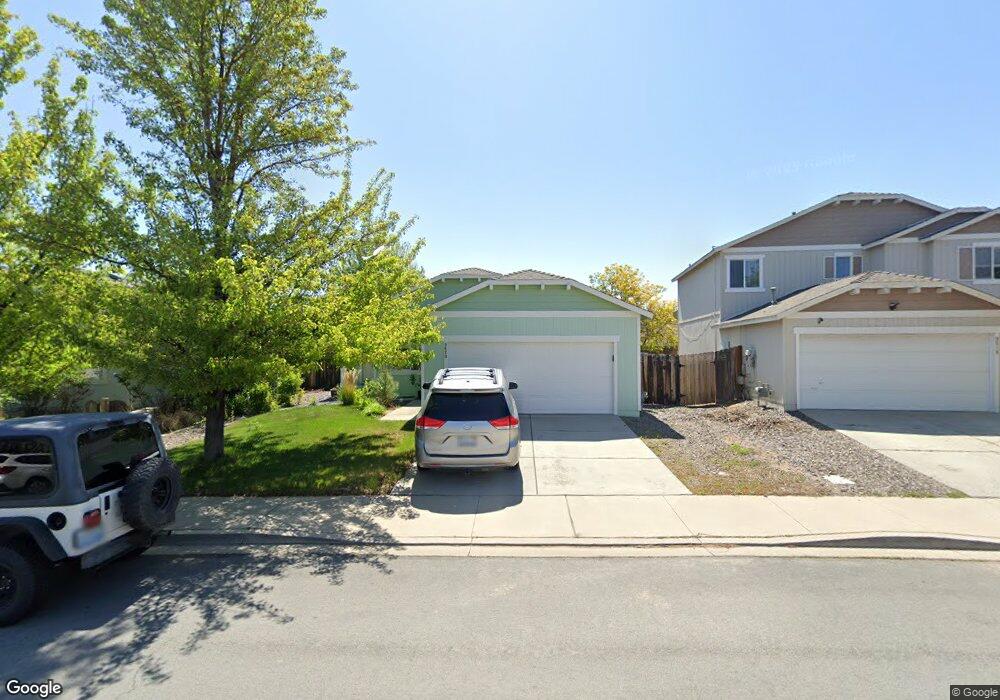
9620 Autumn Leaf Way Reno, NV 89506
Stead NeighborhoodEstimated Value: $397,683 - $436,000
3
Beds
2
Baths
1,394
Sq Ft
$299/Sq Ft
Est. Value
About This Home
This home is located at 9620 Autumn Leaf Way, Reno, NV 89506 and is currently estimated at $416,171, approximately $298 per square foot. 9620 Autumn Leaf Way is a home located in Washoe County with nearby schools including Stead Elementary School, William O'Brien Middle School, and North Valleys High School.
Ownership History
Date
Name
Owned For
Owner Type
Purchase Details
Closed on
May 18, 2015
Sold by
Zhong Qi Bo
Bought by
Huang San Mei
Current Estimated Value
Purchase Details
Closed on
Nov 26, 2014
Sold by
Huang San Mei
Bought by
Zhou Qibo
Purchase Details
Closed on
Jan 20, 2004
Sold by
Ambrosi William H
Bought by
Huang San Mei
Home Financials for this Owner
Home Financials are based on the most recent Mortgage that was taken out on this home.
Original Mortgage
$141,600
Interest Rate
5.86%
Mortgage Type
Unknown
Purchase Details
Closed on
Sep 5, 2002
Sold by
Barker Coleman Construction Llc
Bought by
Ambrosi William H
Home Financials for this Owner
Home Financials are based on the most recent Mortgage that was taken out on this home.
Original Mortgage
$134,335
Interest Rate
6.37%
Mortgage Type
FHA
Create a Home Valuation Report for This Property
The Home Valuation Report is an in-depth analysis detailing your home's value as well as a comparison with similar homes in the area
Home Values in the Area
Average Home Value in this Area
Purchase History
| Date | Buyer | Sale Price | Title Company |
|---|---|---|---|
| Huang San Mei | $118,278 | None Available | |
| Zhou Qibo | $118,500 | None Available | |
| Huang San Mei | $177,000 | Western Title Incorporated | |
| Ambrosi William H | $136,275 | Stewart Title Northern Nevad |
Source: Public Records
Mortgage History
| Date | Status | Borrower | Loan Amount |
|---|---|---|---|
| Previous Owner | Huang San Mei | $141,600 | |
| Previous Owner | Ambrosi William H | $134,335 |
Source: Public Records
Tax History Compared to Growth
Tax History
| Year | Tax Paid | Tax Assessment Tax Assessment Total Assessment is a certain percentage of the fair market value that is determined by local assessors to be the total taxable value of land and additions on the property. | Land | Improvement |
|---|---|---|---|---|
| 2025 | $1,875 | $83,960 | $30,058 | $53,902 |
| 2024 | $1,875 | $80,415 | $26,168 | $54,247 |
| 2023 | $1,910 | $79,507 | $28,130 | $51,378 |
| 2022 | $1,769 | $67,303 | $24,472 | $42,831 |
| 2021 | $1,638 | $62,221 | $19,618 | $42,603 |
| 2020 | $1,540 | $61,225 | $18,554 | $42,671 |
| 2019 | $1,466 | $59,530 | $18,254 | $41,276 |
| 2018 | $1,399 | $53,782 | $13,400 | $40,382 |
| 2017 | $1,343 | $52,886 | $12,469 | $40,417 |
| 2016 | $1,308 | $51,907 | $10,607 | $41,300 |
| 2015 | $1,307 | $50,664 | $9,443 | $41,221 |
| 2014 | $1,266 | $41,398 | $7,781 | $33,617 |
| 2013 | -- | $35,085 | $5,786 | $29,299 |
Source: Public Records
Map
Nearby Homes
- 9493 Long River Dr
- 9542 Angel Falls Dr
- 9599 Canyon Meadows Dr
- 9597 Long River Dr
- 9770 Brightridge Dr
- 10005 Sagewood Dr
- 11165 White Sage Dr
- 9248 Running Dog Cir
- 7800 Lazy Stream Dr
- 7800 Lazy Stream Dr Unit Lot 160
- 7812 Lazy Stream Dr Unit Lot 157
- 7621 Gentle Rain Rd Unit Lot 195
- 9260 Lone Wolf Cir
- 7824 Lazy Stream Dr Unit 154
- 11502 Andes St
- 9255 Lone Wolf Cir
- 7840 Lazy Stream Dr
- 9175 Rising Moon Dr
- 7844 Lazy Stream Dr
- 7848 Lazy Stream Dr Unit 148
- 9616 Autumn Leaf Way
- 9624 Autumn Leaf Way
- 9608 Autumn Leaf Way
- 9628 Autumn Leaf Way
- 9612 Autumn Leaf Way
- 9665 Canyon Meadows Dr
- 9661 Canyon Meadows Dr
- 9667 Canyon Meadows Dr
- 9659 Canyon Meadows Dr
- 9671 Canyon Meadows Dr
- 9619 Autumn Leaf Way
- 9636 Autumn Leaf Way
- 9615 Autumn Leaf Way
- 9675 Canyon Meadows Dr
- 9623 Autumn Leaf Way
- 9655 Canyon Meadows Dr
- 9611 Autumn Leaf Way
- 9604 Autumn Leaf Way
- 9640 Autumn Leaf Way
- 9627 Autumn Leaf Way