96202 Cateret Chapel Hill, NC 27514
Governors Club NeighborhoodEstimated Value: $467,780 - $513,000
2
Beds
3
Baths
1,774
Sq Ft
$276/Sq Ft
Est. Value
About This Home
This home is located at 96202 Cateret, Chapel Hill, NC 27514 and is currently estimated at $490,445, approximately $276 per square foot. 96202 Cateret is a home located in Chatham County with nearby schools including North Chatham Elementary School and Margaret B. Pollard Middle School.
Ownership History
Date
Name
Owned For
Owner Type
Purchase Details
Closed on
Sep 30, 2015
Sold by
Szcodronski Todd Joseph and Szcodronski Cheri
Bought by
Lewis Mary Jane
Current Estimated Value
Purchase Details
Closed on
Mar 14, 2014
Sold by
Bms Investment Properties Llc
Bought by
Szcodronski Todd Joseph and Szcodronski Cheri
Home Financials for this Owner
Home Financials are based on the most recent Mortgage that was taken out on this home.
Original Mortgage
$201,900
Interest Rate
4.5%
Mortgage Type
New Conventional
Purchase Details
Closed on
Mar 18, 2013
Sold by
Pulkingham Nathan C
Bought by
Bms Investment Properties Llc
Home Financials for this Owner
Home Financials are based on the most recent Mortgage that was taken out on this home.
Original Mortgage
$157,437
Interest Rate
3.57%
Mortgage Type
Future Advance Clause Open End Mortgage
Create a Home Valuation Report for This Property
The Home Valuation Report is an in-depth analysis detailing your home's value as well as a comparison with similar homes in the area
Home Values in the Area
Average Home Value in this Area
Purchase History
| Date | Buyer | Sale Price | Title Company |
|---|---|---|---|
| Lewis Mary Jane | $215,000 | Attorney | |
| Szcodronski Todd Joseph | $200,000 | None Available | |
| Bms Investment Properties Llc | $185,220 | None Available |
Source: Public Records
Mortgage History
| Date | Status | Borrower | Loan Amount |
|---|---|---|---|
| Previous Owner | Szcodronski Todd Joseph | $201,900 | |
| Previous Owner | Bms Investment Properties Llc | $157,437 |
Source: Public Records
Tax History Compared to Growth
Tax History
| Year | Tax Paid | Tax Assessment Tax Assessment Total Assessment is a certain percentage of the fair market value that is determined by local assessors to be the total taxable value of land and additions on the property. | Land | Improvement |
|---|---|---|---|---|
| 2025 | $3,704 | $434,195 | $60,000 | $374,195 |
| 2024 | $2,605 | $305,393 | $47,500 | $257,893 |
| 2023 | $1,371 | $305,393 | $47,500 | $257,893 |
| 2022 | $1,258 | $305,393 | $47,500 | $257,893 |
| 2021 | $1,223 | $305,393 | $47,500 | $257,893 |
| 2020 | $1,595 | $257,218 | $47,500 | $209,718 |
| 2019 | $2,126 | $257,218 | $47,500 | $209,718 |
| 2018 | $493 | $257,218 | $47,500 | $209,718 |
| 2017 | $1,972 | $257,218 | $47,500 | $209,718 |
| 2016 | $1,990 | $257,770 | $50,000 | $207,770 |
| 2015 | $1,960 | $257,770 | $50,000 | $207,770 |
| 2014 | $1,921 | $257,770 | $50,000 | $207,770 |
| 2013 | -- | $257,770 | $50,000 | $207,770 |
Source: Public Records
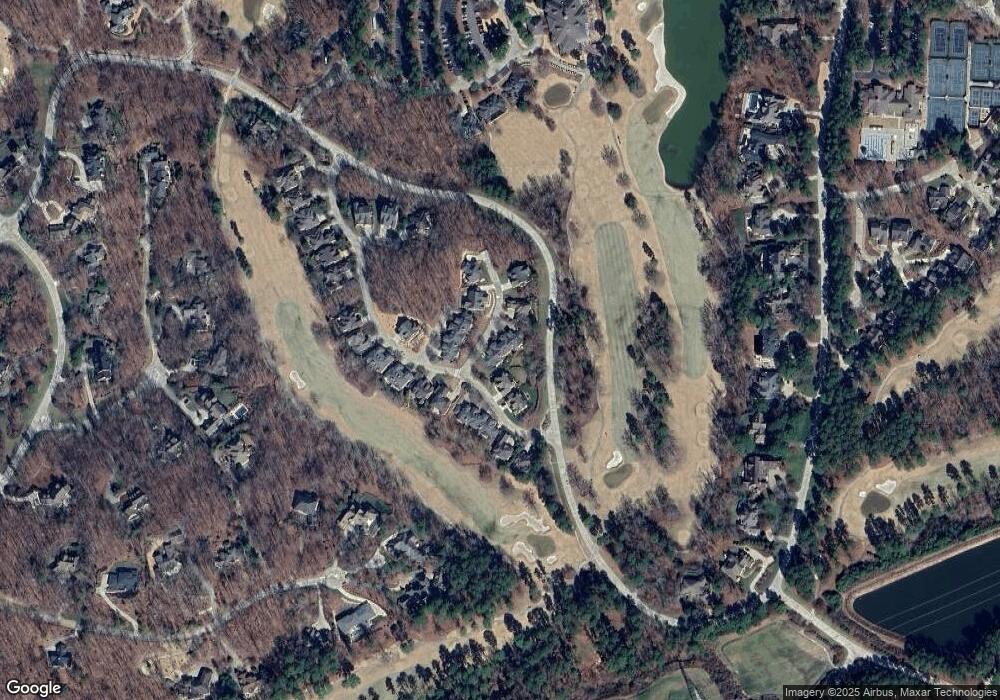
Map
Nearby Homes