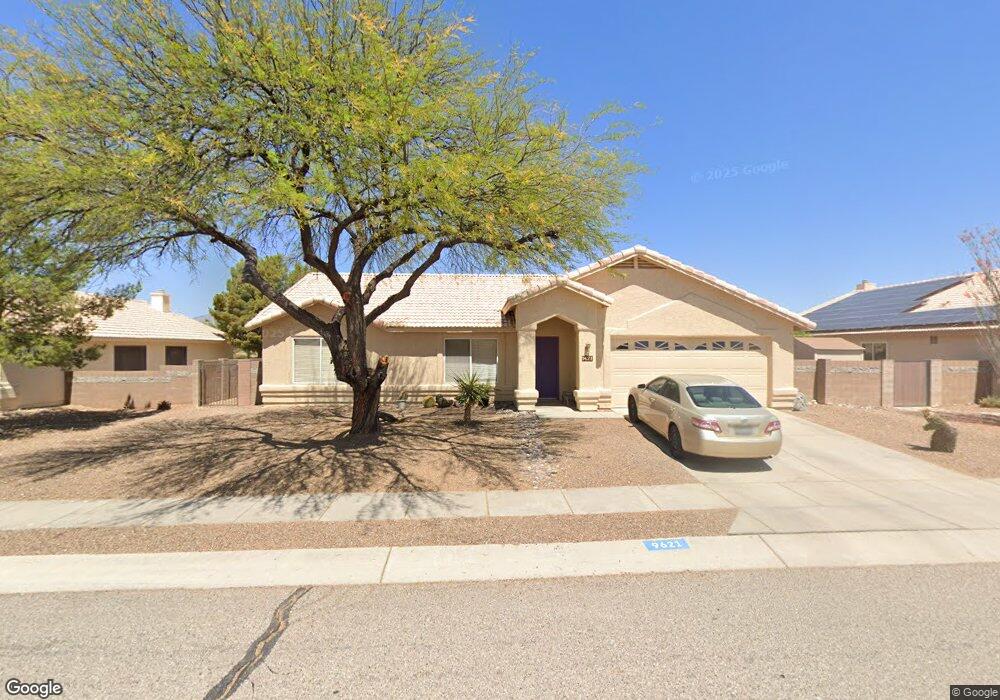
9621 E Catalina Hills Rd Tucson, AZ 85748
Eastside NeighborhoodEstimated Value: $324,623 - $391,000
--
Bed
2
Baths
1,738
Sq Ft
$208/Sq Ft
Est. Value
About This Home
This home is located at 9621 E Catalina Hills Rd, Tucson, AZ 85748 and is currently estimated at $361,656, approximately $208 per square foot. 9621 E Catalina Hills Rd is a home located in Pima County with nearby schools including Gale Elementary School, Gridley Middle School, and Sahuaro High School.
Ownership History
Date
Name
Owned For
Owner Type
Purchase Details
Closed on
Oct 5, 2004
Sold by
Williams Rian
Bought by
Brown Theresa
Current Estimated Value
Home Financials for this Owner
Home Financials are based on the most recent Mortgage that was taken out on this home.
Original Mortgage
$127,800
Interest Rate
5.12%
Mortgage Type
New Conventional
Purchase Details
Closed on
Sep 11, 2004
Sold by
Williams Rian
Bought by
Brown Theresa
Home Financials for this Owner
Home Financials are based on the most recent Mortgage that was taken out on this home.
Original Mortgage
$127,800
Interest Rate
5.12%
Mortgage Type
New Conventional
Purchase Details
Closed on
Nov 14, 1996
Sold by
First American Title Insurance Company
Bought by
Williams Rian G and Brown Theresa M
Home Financials for this Owner
Home Financials are based on the most recent Mortgage that was taken out on this home.
Original Mortgage
$136,843
Interest Rate
7.88%
Mortgage Type
VA
Create a Home Valuation Report for This Property
The Home Valuation Report is an in-depth analysis detailing your home's value as well as a comparison with similar homes in the area
Home Values in the Area
Average Home Value in this Area
Purchase History
| Date | Buyer | Sale Price | Title Company |
|---|---|---|---|
| Brown Theresa | -- | -- | |
| Brown Theresa | -- | -- | |
| Brown Theresa | -- | -- | |
| Williams Rian G | $134,160 | -- |
Source: Public Records
Mortgage History
| Date | Status | Borrower | Loan Amount |
|---|---|---|---|
| Closed | Brown Theresa | $127,800 | |
| Previous Owner | Williams Rian G | $136,843 |
Source: Public Records
Tax History Compared to Growth
Tax History
| Year | Tax Paid | Tax Assessment Tax Assessment Total Assessment is a certain percentage of the fair market value that is determined by local assessors to be the total taxable value of land and additions on the property. | Land | Improvement |
|---|---|---|---|---|
| 2025 | $2,957 | $26,470 | -- | -- |
| 2024 | $2,772 | $25,209 | -- | -- |
| 2023 | $2,772 | $24,009 | $0 | $0 |
| 2022 | $2,793 | $22,866 | $0 | $0 |
| 2021 | $2,803 | $20,740 | $0 | $0 |
| 2020 | $2,690 | $20,740 | $0 | $0 |
| 2019 | $2,613 | $20,151 | $0 | $0 |
| 2018 | $2,492 | $17,916 | $0 | $0 |
| 2017 | $2,379 | $17,916 | $0 | $0 |
| 2016 | $2,452 | $18,041 | $0 | $0 |
| 2015 | $2,345 | $17,182 | $0 | $0 |
Source: Public Records
Map
Nearby Homes
- 907 S Smokey Mountains Rd
- 836 S Lucinda Dr
- 961 S Lucinda Dr
- 880 S Ciudad Cir
- 616 S Spanish Steps Dr
- 1276 S Desert Vista Dr
- 9855 E Cisco Ct
- 9501 E Kokopelli Cir
- 9379 E Grapevine Spring Place
- 9916 E Caldera Place
- 9407 E Field Canyon Place
- 9896 E Wind Dancer Dr
- 9527 E Briana Ln
- 9839 E Spanish Flower Ct
- 411 S Marango Ln
- 10025 E Eric Alan Place
- 9836 E Spanish Flower Ct
- 360 S Marango Ln
- 9716 E Hollow Place
- 10121 E Calle Del Este
- 9611 E Catalina Hills Rd
- 9631 E Catalina Hills Rd
- 9620 E Magdalena Rd
- 9610 E Magdalena Rd
- 9630 E Magdalena Rd
- 9601 E Catalina Hills Rd
- 9622 E Catalina Hills Rd
- 9632 E Catalina Hills Rd
- 9600 E Magdalena Rd
- 9612 E Catalina Hills Rd
- 9651 E Catalina Hills Rd
- 9591 E Catalina Hills Rd
- 9602 E Catalina Hills Rd
- 9652 E Catalina Hills Rd
- 921 S Smokey Mountains Rd
- 9590 E Magdalena Rd
- 9629 E Magdalena Rd
- 9661 E Catalina Hills Rd
- 9619 E Magdalena Rd
- 893 S Smokey Mountains Rd