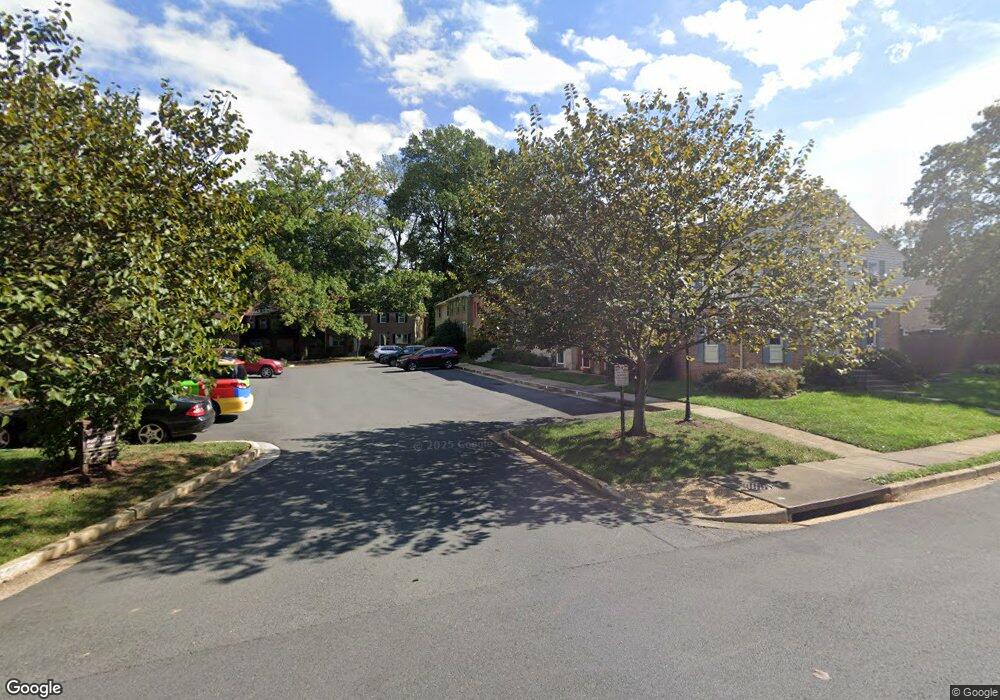
9621 Lindenbrook St Fairfax, VA 22031
Estimated Value: $391,000 - $592,000
3
Beds
4
Baths
1,232
Sq Ft
$435/Sq Ft
Est. Value
About This Home
This home is located at 9621 Lindenbrook St, Fairfax, VA 22031 and is currently estimated at $535,385, approximately $434 per square foot. 9621 Lindenbrook St is a home located in Fairfax County with nearby schools including Mosby Woods Elementary School, Thoreau Middle School, and Appletree School.
Ownership History
Date
Name
Owned For
Owner Type
Purchase Details
Closed on
Mar 25, 2022
Sold by
Chang Hyon Ho and Chang Myung Ja
Bought by
Chang Myung Ja and Chang Jessica E
Current Estimated Value
Purchase Details
Closed on
Jul 19, 2001
Sold by
White Angela B Smith
Bought by
Chang Myung J
Home Financials for this Owner
Home Financials are based on the most recent Mortgage that was taken out on this home.
Original Mortgage
$159,000
Interest Rate
7.2%
Create a Home Valuation Report for This Property
The Home Valuation Report is an in-depth analysis detailing your home's value as well as a comparison with similar homes in the area
Home Values in the Area
Average Home Value in this Area
Purchase History
| Date | Buyer | Sale Price | Title Company |
|---|---|---|---|
| Chang Myung Ja | -- | International Title | |
| Chang Myung J | $199,000 | -- |
Source: Public Records
Mortgage History
| Date | Status | Borrower | Loan Amount |
|---|---|---|---|
| Previous Owner | Chang Myung J | $159,000 |
Source: Public Records
Tax History Compared to Growth
Tax History
| Year | Tax Paid | Tax Assessment Tax Assessment Total Assessment is a certain percentage of the fair market value that is determined by local assessors to be the total taxable value of land and additions on the property. | Land | Improvement |
|---|---|---|---|---|
| 2025 | $5,689 | $559,730 | $195,000 | $364,730 |
| 2024 | $5,689 | $491,050 | $170,000 | $321,050 |
| 2023 | $5,465 | $484,230 | $170,000 | $314,230 |
| 2022 | $5,747 | $502,580 | $170,000 | $332,580 |
| 2021 | $5,280 | $449,920 | $155,000 | $294,920 |
| 2020 | $5,281 | $446,200 | $155,000 | $291,200 |
| 2019 | $5,281 | $446,200 | $155,000 | $291,200 |
| 2018 | $4,914 | $427,330 | $150,000 | $277,330 |
| 2017 | $4,459 | $384,030 | $138,000 | $246,030 |
| 2016 | $4,347 | $375,210 | $134,000 | $241,210 |
| 2015 | $4,187 | $375,210 | $134,000 | $241,210 |
| 2014 | $4,055 | $364,180 | $130,000 | $234,180 |
Source: Public Records
Map
Nearby Homes
- 3003 Mission Square Dr
- 9606 Blake Ln
- 0 Blake Ln Blake Ln Service Rd Unit VAFX2167468
- 3054 Mission Square Dr
- 2960 Vaden Dr Unit 2-406
- 2960 Vaden Dr Unit 2-307
- 2960 Vaden Dr Unit 2-312
- 2960 Vaden Dr Unit 413
- 3033 White Birch Ct
- 3065 White Birch Ct
- 2903 Saintsbury Plaza Unit 310
- 2903 Saintsbury Plaza Unit 405
- 2905 Saintsbury Plaza Unit 312
- 9523 Bastille St Unit 207
- 9713 Kings Crown Ct Unit 1
- 9555 Saintsbury Dr Unit 503
- 9652 Pullman Place
- 9730 Kingsbridge Dr Unit 202
- 9715 Kings Crown Ct Unit 202
- 9720 Five Oaks Rd
- 9619 Lindenbrook St
- 9623 Lindenbrook St
- 9617 Lindenbrook St
- 9625 Lindenbrook St
- 9627 Lindenbrook St
- 9615 Lindenbrook St
- 9635 Lindenbrook St
- 9633 Lindenbrook St
- 9637 Lindenbrook St
- 9631 Lindenbrook St
- 9639 Lindenbrook St
- 9629 Lindenbrook St
- 9641 Lindenbrook St
- 9591 Blake Park Ct
- 9613 Lindenbrook St
- 9643 Lindenbrook St
- 9589 Blake Park Ct
- 9645 Lindenbrook St
- 9607 Lindenbrook St
- 9611 Lindenbrook St