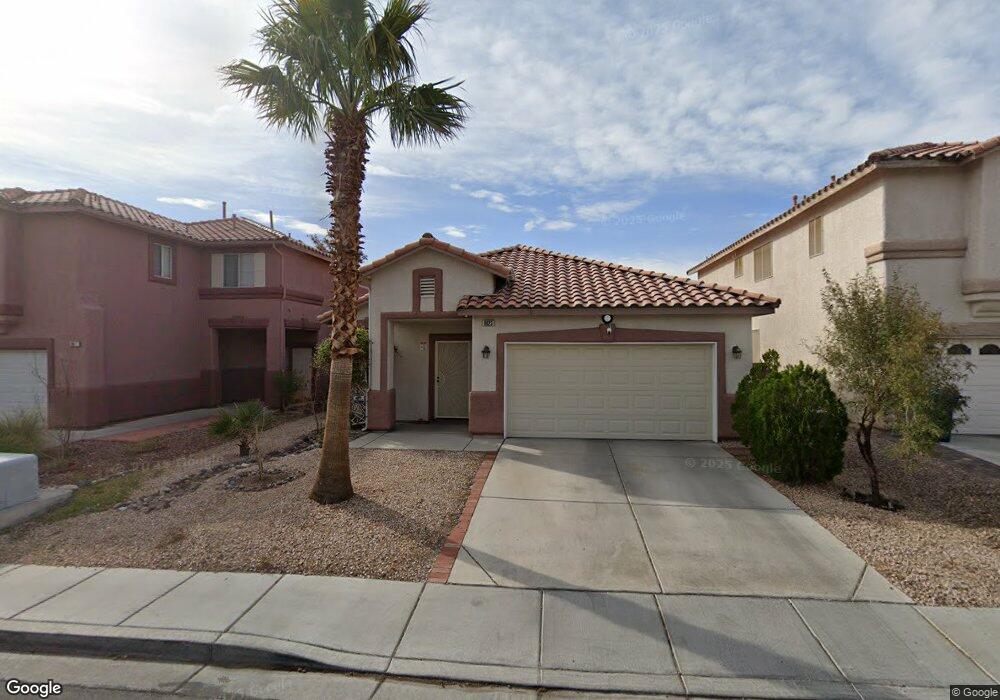
9623 Rainfall Ave Las Vegas, NV 89147
Rancho Viejo NeighborhoodEstimated Value: $443,000 - $473,000
3
Beds
2
Baths
1,603
Sq Ft
$284/Sq Ft
Est. Value
About This Home
This home is located at 9623 Rainfall Ave, Las Vegas, NV 89147 and is currently estimated at $455,490, approximately $284 per square foot. 9623 Rainfall Ave is a home located in Clark County with nearby schools including Keith C. & Karen W. Hayes Elementary School, Victoria Fertitta Middle School, and Spring Valley High School.
Ownership History
Date
Name
Owned For
Owner Type
Purchase Details
Closed on
Oct 3, 2014
Sold by
Li Zhuan Zhen
Bought by
Li Zhuan Zhen and Li De Jian
Current Estimated Value
Purchase Details
Closed on
Jan 6, 2009
Sold by
Li De Jian and Li Zhuan Zhen
Bought by
Li Zhuan Zhen
Purchase Details
Closed on
Oct 10, 2005
Sold by
Li De Jian
Bought by
Li De Jian and Li Zhuan Zhen
Purchase Details
Closed on
Jul 2, 2003
Sold by
Khatisyan Gayan E
Bought by
Li De Jian
Home Financials for this Owner
Home Financials are based on the most recent Mortgage that was taken out on this home.
Original Mortgage
$180,500
Outstanding Balance
$76,219
Interest Rate
5.17%
Mortgage Type
Unknown
Estimated Equity
$379,271
Purchase Details
Closed on
Oct 9, 2000
Sold by
Karapetyan Krist
Bought by
Khatisyan Gayane
Home Financials for this Owner
Home Financials are based on the most recent Mortgage that was taken out on this home.
Original Mortgage
$137,750
Interest Rate
7.96%
Create a Home Valuation Report for This Property
The Home Valuation Report is an in-depth analysis detailing your home's value as well as a comparison with similar homes in the area
Home Values in the Area
Average Home Value in this Area
Purchase History
| Date | Buyer | Sale Price | Title Company |
|---|---|---|---|
| Li Zhuan Zhen | -- | None Available | |
| Li Zhuan Zhen | -- | None Available | |
| Li De Jian | -- | -- | |
| Li De Jian | $190,000 | Fidelity National Title | |
| Khatisyan Gayane | -- | First American Title Co | |
| Khatisyan Gayane | $153,082 | First American Title Co |
Source: Public Records
Mortgage History
| Date | Status | Borrower | Loan Amount |
|---|---|---|---|
| Open | Li De Jian | $180,500 | |
| Previous Owner | Khatisyan Gayane | $137,750 |
Source: Public Records
Tax History Compared to Growth
Tax History
| Year | Tax Paid | Tax Assessment Tax Assessment Total Assessment is a certain percentage of the fair market value that is determined by local assessors to be the total taxable value of land and additions on the property. | Land | Improvement |
|---|---|---|---|---|
| 2025 | $1,822 | $105,219 | $41,300 | $63,919 |
| 2024 | $1,769 | $105,219 | $41,300 | $63,919 |
| 2023 | $1,444 | $97,092 | $36,400 | $60,692 |
| 2022 | $1,718 | $85,552 | $30,100 | $55,452 |
| 2021 | $1,668 | $78,617 | $25,900 | $52,717 |
| 2020 | $1,616 | $76,839 | $24,500 | $52,339 |
| 2019 | $1,569 | $74,269 | $22,750 | $51,519 |
| 2018 | $1,524 | $67,823 | $18,200 | $49,623 |
| 2017 | $1,977 | $67,414 | $17,150 | $50,264 |
| 2016 | $1,444 | $61,852 | $11,550 | $50,302 |
| 2015 | $1,440 | $51,072 | $10,850 | $40,222 |
| 2014 | $1,398 | $46,245 | $9,800 | $36,445 |
Source: Public Records
Map
Nearby Homes
- 9605 Rainfall Ave
- 3580 Teton Hills St
- 9750 W Cherokee Ave Unit 1
- 9750 Pine Thickett Ave
- 9506 Teton Diablo Ave
- 9514 Teton Vista Ave
- 9785 Turtle Head Ct
- 3381 Biscayne Bay Dr
- 3390 Syvella Ct
- 9545 Canyonland Ct
- 3751 Morning Canyon St
- 3757 Horseshoe Mesa St
- 3340 Shallow Pond Dr
- 9475 Sand Villa Ct
- 9376 Peace Pipe Ct
- 9857 Pioneer Ave
- 9718 Camino Capistrano Ln
- 9886 Masked Duck Ave
- 9357 Golden Timber Ln
- 9758 Camino Capistrano Ln
- 9629 Rainfall Ave
- 9635 Rainfall Ave
- 9611 Rainfall Ave
- 9624 Windborne Ave
- 9618 Windborne Ave
- 9630 Windborne Ave Unit house
- 9630 Windborne Ave
- 9641 Rainfall Ave
- 9612 Windborne Ave
- 9636 Windborne Ave
- 9624 Rainfall Ave
- 9618 Rainfall Ave
- 9612 Rainfall Ave
- 9606 Windborne Ave
- 9630 Rainfall Ave
- 9599 Rainfall Ave
- 9647 Rainfall Ave
- 9606 Rainfall Ave