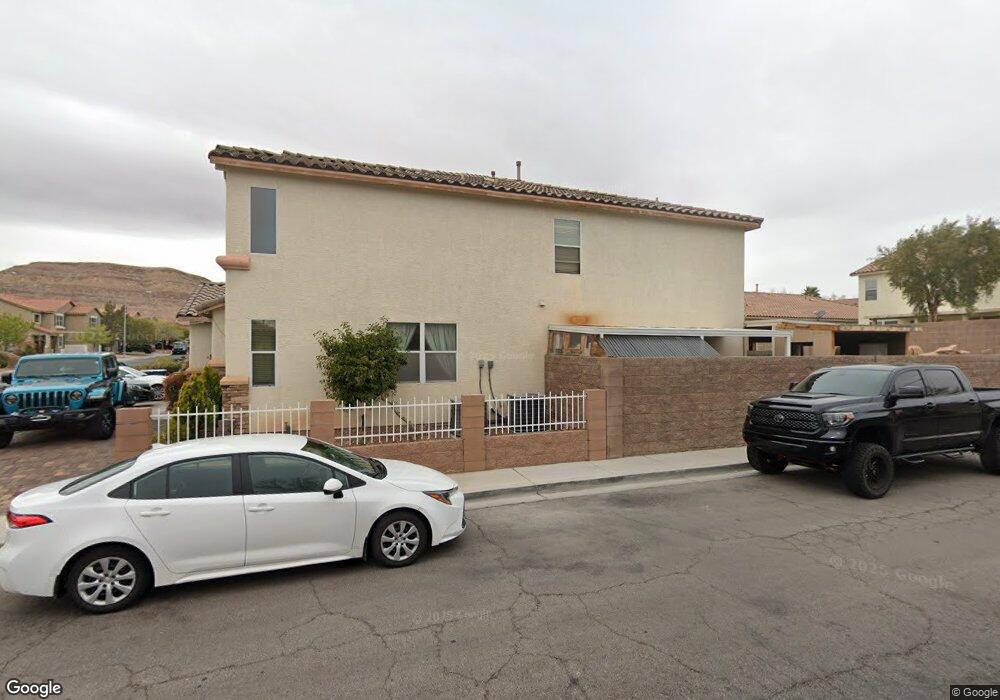
9624 W Post Rd Las Vegas, NV 89148
Estimated Value: $674,000 - $721,575
5
Beds
4
Baths
3,359
Sq Ft
$207/Sq Ft
Est. Value
About This Home
This home is located at 9624 W Post Rd, Las Vegas, NV 89148 and is currently estimated at $696,144, approximately $207 per square foot. 9624 W Post Rd is a home located in Clark County with nearby schools including Shelley Berkley Elementary School, Wilbur & Theresa Faiss Middle School, and Sierra Vista High School.
Ownership History
Date
Name
Owned For
Owner Type
Purchase Details
Closed on
Oct 6, 2022
Sold by
Antonio Rufino and Antonio Natividad
Bought by
Sakoff Ronashell Antonio
Current Estimated Value
Purchase Details
Closed on
Nov 7, 2020
Sold by
Sakoff Ronashell Antonio
Bought by
Antonio Rufino and Antonio Natividad
Purchase Details
Closed on
May 24, 2006
Sold by
Wu Ya
Bought by
Antonio Ronashell T
Home Financials for this Owner
Home Financials are based on the most recent Mortgage that was taken out on this home.
Original Mortgage
$490,500
Interest Rate
9.4%
Mortgage Type
Unknown
Purchase Details
Closed on
Jun 26, 2003
Sold by
Beazer Homes Holdings Corp
Bought by
Antonio Ronashell T
Home Financials for this Owner
Home Financials are based on the most recent Mortgage that was taken out on this home.
Original Mortgage
$267,800
Interest Rate
5.37%
Mortgage Type
Unknown
Create a Home Valuation Report for This Property
The Home Valuation Report is an in-depth analysis detailing your home's value as well as a comparison with similar homes in the area
Home Values in the Area
Average Home Value in this Area
Purchase History
| Date | Buyer | Sale Price | Title Company |
|---|---|---|---|
| Sakoff Ronashell Antonio | -- | -- | |
| Antonio Rufino | -- | None Available | |
| Antonio Ronashell T | -- | Chicago Title | |
| Antonio Ronashell T | $281,931 | Lawyers Title Of Nevada |
Source: Public Records
Mortgage History
| Date | Status | Borrower | Loan Amount |
|---|---|---|---|
| Previous Owner | Antonio Ronashell T | $490,500 | |
| Previous Owner | Antonio Ronashell T | $267,800 |
Source: Public Records
Tax History Compared to Growth
Tax History
| Year | Tax Paid | Tax Assessment Tax Assessment Total Assessment is a certain percentage of the fair market value that is determined by local assessors to be the total taxable value of land and additions on the property. | Land | Improvement |
|---|---|---|---|---|
| 2025 | $4,078 | $190,170 | $49,700 | $140,470 |
| 2024 | $3,921 | $190,170 | $49,700 | $140,470 |
| 2023 | $3,921 | $179,124 | $46,550 | $132,574 |
| 2022 | $3,792 | $157,718 | $36,750 | $120,968 |
| 2021 | $3,800 | $147,466 | $32,550 | $114,916 |
| 2020 | $2,994 | $144,642 | $30,800 | $113,842 |
| 2019 | $2,806 | $140,113 | $28,000 | $112,113 |
| 2018 | $2,677 | $130,380 | $23,100 | $107,280 |
| 2017 | $3,488 | $118,945 | $21,000 | $97,945 |
| 2016 | $2,780 | $109,905 | $19,250 | $90,655 |
| 2015 | $2,775 | $119,031 | $13,300 | $105,731 |
| 2014 | $2,703 | $80,325 | $9,800 | $70,525 |
Source: Public Records
Map
Nearby Homes
- 9628 Scrub Jay Ct
- 6336 Fence Post St
- 9709 Hawk Cliff Ave
- 9611 Aberdeen Ridge Ct
- 9632 Abbey Pond Ave
- 6169 Novelty St
- 6234 Burrell Ct
- 6067 Doroca St
- 6125 Powdermill St
- 9505 Delivery Ave
- 9564 Fresh Crown Ct
- 9680 Waukegan Ave
- 9624 Sage Sparrow Ave
- 9611 Sage Sparrow Ave
- 9899 Vista Meadows Ave
- 10056 Cranbrook Falls Ct
- 10039 Pelham Park Ave
- 6642 Titanium Crest St
- 9889 Gemstone Sunset Ave
- 6449 Lake Scene St
- 9632 W Post Rd
- 9640 W Post Rd
- 9637 Grouse Grove Ave
- 6286 Ruby Kinglet St
- 6294 Ruby Kinglet St
- 6278 Ruby Kinglet St
- 9645 Grouse Grove Ave
- 9648 W Post Rd
- 9631 W Post Rd
- 9623 W Post Rd
- 9639 W Post Rd
- 6270 Ruby Kinglet St
- 9653 Grouse Grove Ave
- 9617 W Post Rd
- 9647 W Post Rd
- 9656 W Post Rd
- 6262 Ruby Kinglet St
- 9611 W Post Rd
- 9611 W Post Rd Unit n/a
- 9661 Grouse Grove Ave