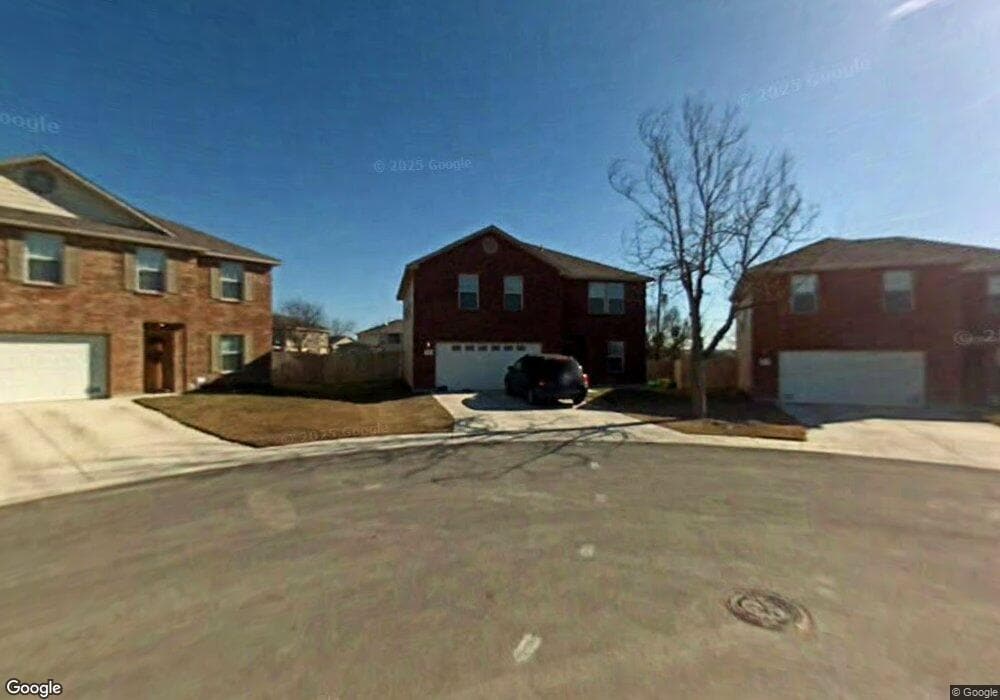
9628 Dublin Green San Antonio, TX 78254
Estimated Value: $298,874 - $325,000
5
Beds
3
Baths
2,622
Sq Ft
$120/Sq Ft
Est. Value
About This Home
This home is located at 9628 Dublin Green, San Antonio, TX 78254 and is currently estimated at $314,969, approximately $120 per square foot. 9628 Dublin Green is a home located in Bexar County with nearby schools including Fields Elementary and Jefferson Middle School.
Ownership History
Date
Name
Owned For
Owner Type
Purchase Details
Closed on
Jul 29, 2016
Sold by
Derose Michael James
Bought by
Ramirez Carlos and Ramirez Natalie M
Current Estimated Value
Home Financials for this Owner
Home Financials are based on the most recent Mortgage that was taken out on this home.
Original Mortgage
$198,550
Outstanding Balance
$158,726
Interest Rate
3.54%
Mortgage Type
New Conventional
Estimated Equity
$156,243
Purchase Details
Closed on
Oct 14, 2015
Sold by
Melero Marcelo R and Melero Leticia A
Bought by
Derose Michael James
Purchase Details
Closed on
Feb 20, 2007
Sold by
Michael Sivage Homes & Communities Ltd
Bought by
Melero Marcelo R and Melero Leticia A
Home Financials for this Owner
Home Financials are based on the most recent Mortgage that was taken out on this home.
Original Mortgage
$179,481
Interest Rate
6.17%
Mortgage Type
Purchase Money Mortgage
Create a Home Valuation Report for This Property
The Home Valuation Report is an in-depth analysis detailing your home's value as well as a comparison with similar homes in the area
Home Values in the Area
Average Home Value in this Area
Purchase History
| Date | Buyer | Sale Price | Title Company |
|---|---|---|---|
| Ramirez Carlos | -- | American Title Company | |
| Derose Michael James | $137,500 | None Available | |
| Melero Marcelo R | -- | Lalt |
Source: Public Records
Mortgage History
| Date | Status | Borrower | Loan Amount |
|---|---|---|---|
| Open | Ramirez Carlos | $198,550 | |
| Previous Owner | Melero Marcelo R | $179,481 |
Source: Public Records
Tax History Compared to Growth
Tax History
| Year | Tax Paid | Tax Assessment Tax Assessment Total Assessment is a certain percentage of the fair market value that is determined by local assessors to be the total taxable value of land and additions on the property. | Land | Improvement |
|---|---|---|---|---|
| 2025 | $5,579 | $298,250 | $55,450 | $242,800 |
| 2024 | $5,579 | $301,160 | $55,450 | $245,710 |
| 2023 | $5,579 | $323,370 | $55,450 | $267,920 |
| 2022 | $5,780 | $284,580 | $46,220 | $238,360 |
| 2021 | $5,020 | $238,460 | $42,060 | $196,400 |
| 2020 | $4,789 | $222,690 | $42,060 | $180,630 |
| 2019 | $4,552 | $205,000 | $29,750 | $175,250 |
| 2018 | $4,407 | $198,310 | $29,750 | $168,560 |
| 2017 | $4,361 | $195,810 | $29,750 | $166,060 |
| 2016 | $4,130 | $185,440 | $29,750 | $155,690 |
| 2015 | $3,391 | $176,682 | $25,000 | $153,390 |
| 2014 | $3,391 | $160,620 | $0 | $0 |
Source: Public Records
Map
Nearby Homes
- 9407 Pegasus Run Rd
- 9510 Caspian Forest
- 10814 Mustang Oak Dr
- 9216 Dublin Green
- 9103 Mare Trace
- 11018 Dublin Field
- 9218 Mare Country
- 9726 Palomino Oaks
- 9103 Mare Hunt
- 11463 Feather Vale
- 11420 Feather Vale
- 11451 Feather Vale
- 11459 Feather Vale
- 11452 Feather Vale Blank
- 11447 Feather Vale Blank
- 11003 Dublin Briar
- 9714 Connemara Bend
- 10703 Spirit Roam
- 9011 Mustang Pass
- 11207 Geneva Ford
- 9624 Dublin Green
- 10903 Geneva Moon
- 9551 Gold Stage Rd
- 10830 Pony Mesa
- 9620 Dublin Green
- 9503 Caspian Forest
- 10907 Geneva Moon
- 9547 Gold Stage Rd
- 9555 Gold Stage Rd
- 10826 Pony Mesa
- 9543 Gold Stage Rd
- 10902 Buckskin Bend
- 10911 Geneva Moon
- 10906 Buckskin Bend
- 10822 Pony Mesa
- 9539 Gold Stage Rd
- 10908 Geneva Moon
- 9507 Caspian Forest
- 10923 Flying Fury Dr
- 9612 Dublin Green