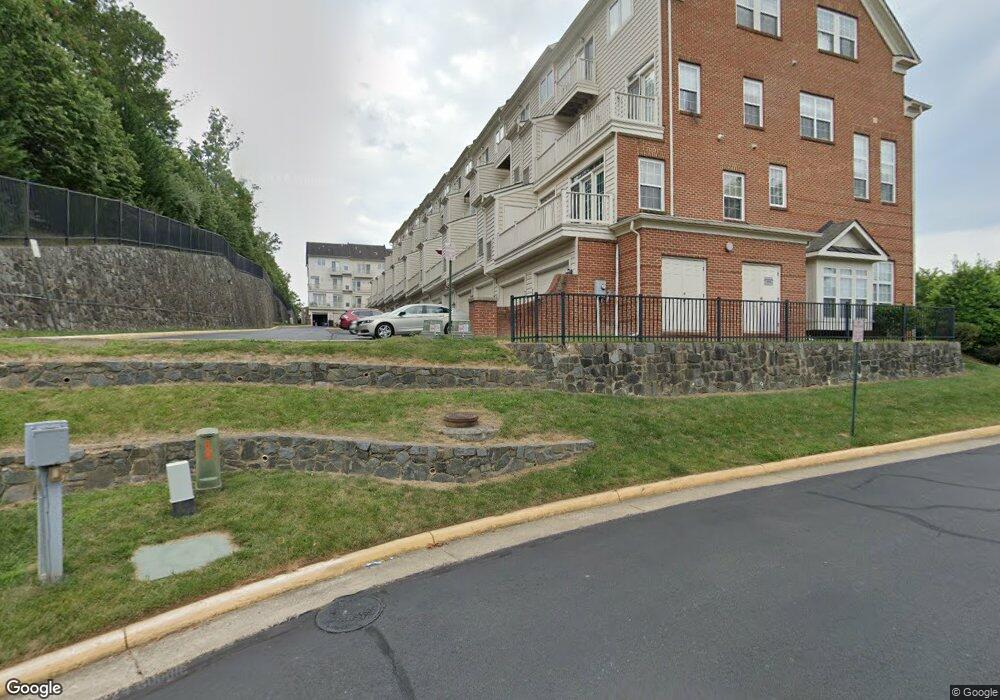
9628 Wigfall Way Unit 87 Manassas Park, VA 20111
Bloom Crossing NeighborhoodEstimated Value: $356,779 - $395,000
3
Beds
3
Baths
1,298
Sq Ft
$288/Sq Ft
Est. Value
About This Home
This home is located at 9628 Wigfall Way Unit 87, Manassas Park, VA 20111 and is currently estimated at $374,195, approximately $288 per square foot. 9628 Wigfall Way Unit 87 is a home located in Manassas Park City with nearby schools including Cougar Elementary School, Manassas Park Elementary School, and Manassas Park Middle School.
Ownership History
Date
Name
Owned For
Owner Type
Purchase Details
Closed on
Dec 14, 2011
Sold by
Lighty Felton A and Lighty Sherita L
Bought by
Maestas Kaylyn
Current Estimated Value
Home Financials for this Owner
Home Financials are based on the most recent Mortgage that was taken out on this home.
Original Mortgage
$188,107
Outstanding Balance
$127,061
Interest Rate
3.75%
Mortgage Type
FHA
Estimated Equity
$247,134
Purchase Details
Closed on
Nov 24, 2009
Sold by
Lamm Daniel Abram
Bought by
Lighty Felton A and Lighty Sherita L
Home Financials for this Owner
Home Financials are based on the most recent Mortgage that was taken out on this home.
Original Mortgage
$171,830
Interest Rate
4.92%
Mortgage Type
FHA
Purchase Details
Closed on
Sep 29, 2006
Sold by
Centex Homes
Bought by
Lamm Daniel Abram
Home Financials for this Owner
Home Financials are based on the most recent Mortgage that was taken out on this home.
Original Mortgage
$268,492
Interest Rate
6.52%
Mortgage Type
New Conventional
Create a Home Valuation Report for This Property
The Home Valuation Report is an in-depth analysis detailing your home's value as well as a comparison with similar homes in the area
Home Values in the Area
Average Home Value in this Area
Purchase History
| Date | Buyer | Sale Price | Title Company |
|---|---|---|---|
| Maestas Kaylyn | $193,000 | First American | |
| Lighty Felton A | $175,000 | Stewart Title | |
| Lamm Daniel Abram | $335,615 | -- |
Source: Public Records
Mortgage History
| Date | Status | Borrower | Loan Amount |
|---|---|---|---|
| Open | Maestas Kaylyn | $188,107 | |
| Previous Owner | Lighty Felton A | $171,830 | |
| Previous Owner | Lamm Daniel Abram | $268,492 |
Source: Public Records
Tax History Compared to Growth
Tax History
| Year | Tax Paid | Tax Assessment Tax Assessment Total Assessment is a certain percentage of the fair market value that is determined by local assessors to be the total taxable value of land and additions on the property. | Land | Improvement |
|---|---|---|---|---|
| 2025 | $3,647 | $332,100 | $87,600 | $244,500 |
| 2024 | $3,647 | $316,300 | $87,600 | $228,700 |
| 2023 | $3,647 | $263,200 | $87,600 | $175,600 |
| 2022 | $3,496 | $246,000 | $83,400 | $162,600 |
| 2021 | $3,373 | $223,600 | $72,500 | $151,100 |
| 2020 | $3,156 | $212,900 | $69,000 | $143,900 |
| 2019 | $3,156 | $198,900 | $63,300 | $135,600 |
| 2018 | $2,794 | $184,100 | $63,300 | $120,800 |
| 2017 | $2,733 | $180,400 | $63,300 | $117,100 |
| 2016 | $2,714 | $175,100 | $63,300 | $111,800 |
| 2015 | $3,027 | $175,100 | $63,300 | $111,800 |
| 2014 | $3,027 | $171,600 | $63,300 | $108,300 |
Source: Public Records
Map
Nearby Homes
- 9508 Walker Way
- 9720 Holmes Place Unit 2
- 9720 Holmes Place Unit 4
- 9722 Holmes Place Unit 203
- 9700 Elzey Place Unit 302
- 9710 Handerson Place Unit 302
- 9748 Corbett Cir
- 9264 Kristy Dr
- 9097 Belo Gate Dr
- 9800 Pickens Place
- 609 Percy Place
- 613 Percy Place
- 9842 Pickens Place
- 201 Park Central Terrace Unit B
- 203 Park Central Terrace
- 707 Thomas Ln Unit B
- 1014 Mays Ln
- 1008 Mays Ln
- 1108A Dabney Dr
- 1110A Dabney Dr
- 9512 Walker Way
- 9546 Walker Way Unit 12
- 9520 Walker Way
- 9522 Walker Way Unit 32
- 9567 Walker Way
- 9501 Walker Way
- 9624 Wigfall Way Unit 85
- 9505 Walker Way
- 9505 Walker Way Unit 9505
- 9507 Walker Way
- 9509 Walker Way Unit 37
- 9509 Walker Way Unit DRIVE
- 9102 Owens Dr
- 9518 Walker Way
- 9572 Walker Way
- 9516 Walker Way Unit 29
- 9568 Walker Way
- 9500 Walker Way Unit 21
- 9513 Walker Way
- 9634 Wigfall Way