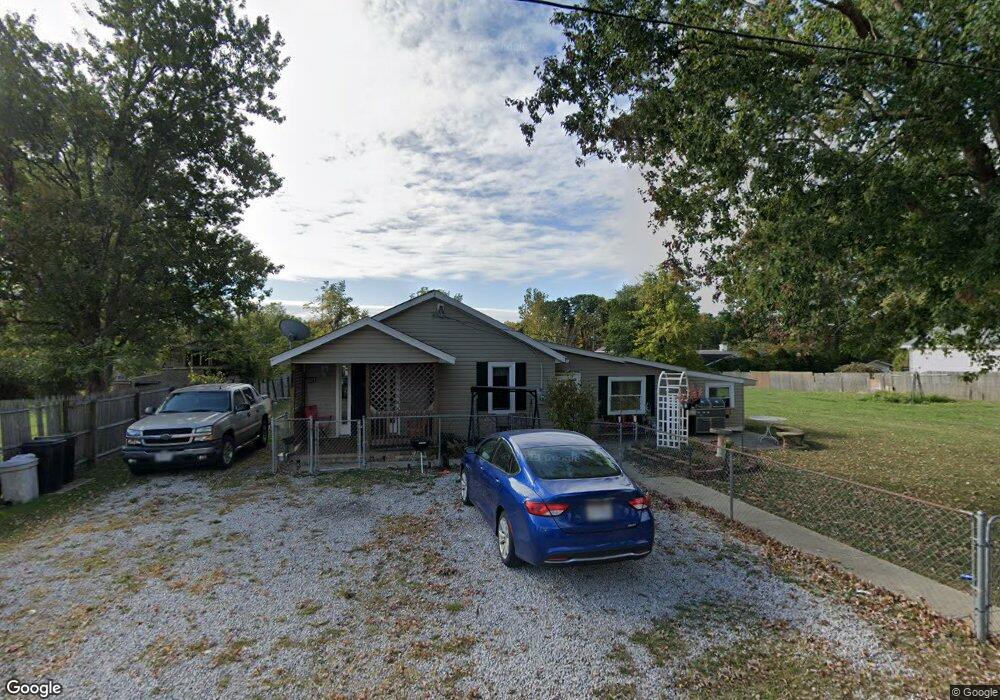
963 Drexel Ave Marion, OH 43302
Estimated Value: $137,000 - $231,000
2
Beds
1
Bath
1,847
Sq Ft
$106/Sq Ft
Est. Value
About This Home
This home is located at 963 Drexel Ave, Marion, OH 43302 and is currently estimated at $195,137, approximately $105 per square foot. 963 Drexel Ave is a home located in Marion County with nearby schools including Pleasant Elementary School, Pleasant Middle School, and Pleasant High School.
Ownership History
Date
Name
Owned For
Owner Type
Purchase Details
Closed on
Sep 17, 2015
Sold by
Foursouth Land Management Llc
Bought by
Drown Jackie Dale and Brown Vanessa L
Current Estimated Value
Home Financials for this Owner
Home Financials are based on the most recent Mortgage that was taken out on this home.
Original Mortgage
$50,400
Outstanding Balance
$20,164
Interest Rate
3.91%
Mortgage Type
New Conventional
Estimated Equity
$174,973
Purchase Details
Closed on
Oct 24, 2014
Sold by
Hunt Ralph
Bought by
Foursouth Land Management Llc
Purchase Details
Closed on
Aug 12, 2005
Sold by
Hunt Ralph and Hunt Eula Faye
Bought by
Brown Jackie Dale and Brown Vanesa L
Purchase Details
Closed on
Apr 26, 2005
Sold by
Bank Of New York
Bought by
Hunt Ralph and Hunt Eula Faye
Purchase Details
Closed on
May 28, 2004
Bought by
Brown Jackie D and Surv Vanessa L
Purchase Details
Closed on
Jul 2, 1999
Bought by
Brown Jackie D and Surv Vanessa L
Create a Home Valuation Report for This Property
The Home Valuation Report is an in-depth analysis detailing your home's value as well as a comparison with similar homes in the area
Home Values in the Area
Average Home Value in this Area
Purchase History
| Date | Buyer | Sale Price | Title Company |
|---|---|---|---|
| Drown Jackie Dale | $62,000 | Ct | |
| Foursouth Land Management Llc | -- | None Available | |
| Brown Jackie Dale | $62,000 | None Available | |
| Hunt Ralph | $21,500 | Sovereign Title Agency Llc | |
| Brown Jackie D | $26,700 | -- | |
| Brown Jackie D | $30,000 | -- |
Source: Public Records
Mortgage History
| Date | Status | Borrower | Loan Amount |
|---|---|---|---|
| Open | Drown Jackie Dale | $50,400 |
Source: Public Records
Tax History Compared to Growth
Tax History
| Year | Tax Paid | Tax Assessment Tax Assessment Total Assessment is a certain percentage of the fair market value that is determined by local assessors to be the total taxable value of land and additions on the property. | Land | Improvement |
|---|---|---|---|---|
| 2024 | $1,959 | $42,120 | $2,160 | $39,960 |
| 2023 | $1,959 | $42,120 | $2,160 | $39,960 |
| 2022 | $1,958 | $42,120 | $2,160 | $39,960 |
| 2021 | $1,620 | $32,210 | $1,700 | $30,510 |
| 2020 | $1,602 | $32,210 | $1,700 | $30,510 |
| 2019 | $1,639 | $32,210 | $1,700 | $30,510 |
| 2018 | $631 | $17,450 | $1,790 | $15,660 |
| 2017 | $633 | $17,450 | $1,790 | $15,660 |
| 2016 | $629 | $17,450 | $1,790 | $15,660 |
| 2015 | $660 | $17,070 | $1,700 | $15,370 |
| 2014 | $662 | $17,070 | $1,700 | $15,370 |
| 2012 | $817 | $20,050 | $1,730 | $18,320 |
Source: Public Records
Map
Nearby Homes
- 1178 Cheney Ave
- 1406 Plantation Dr
- 989 Davids St
- 981 Davids St
- 1133 Amherst Dr
- 927 Bellefontaine Ave
- 0 Bellefontaine Ave
- 786 Sheridan Rd
- 772 Sheridan Rd
- 757 Merkle Ave
- 796 Woodrow Ave
- 720 Woodrow Ave
- 0 Independence Ave
- 889 Oak Grove Ave
- 950 Oak Grove Ave
- 681 Davids St
- 668 Uncapher Ave
- 645 Henry St
- 625 Rochelle Dr
- Tract 1-6 Southland Pkwy
- 957 Drexel Ave
- 979 Drexel Ave
- 964 van Atta Ave
- 976 van Atta Ave
- 982 van Atta Ave
- 958 Drexel Ave
- 972 Drexel Ave
- 987 Drexel Ave
- 948 Drexel Ave
- 1016 van Atta Ave
- 1509 White Oaks Rd
- 982 Drexel Ave
- 993 Drexel Ave
- 1481 White Oaks Rd
- 953 Olive Ave
- 1473 White Oaks Rd
- 937 Olive Ave
- 937 Olive Ave
- 937 Olive Ave
- 996 Drexel Ave