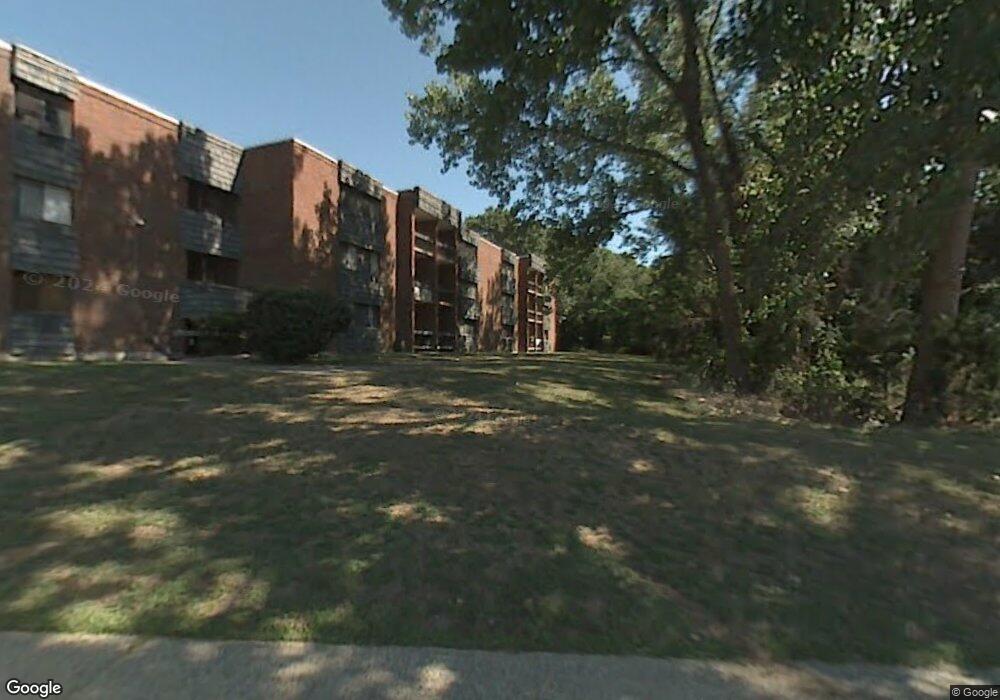
963 High Path Rd Windsor, CT 06095
West Windsor NeighborhoodEstimated Value: $95,231 - $139,000
1
Bed
2
Baths
723
Sq Ft
$166/Sq Ft
Est. Value
About This Home
This home is located at 963 High Path Rd, Windsor, CT 06095 and is currently estimated at $119,808, approximately $165 per square foot. 963 High Path Rd is a home located in Hartford County with nearby schools including Oliver Ellsworth School, John F. Kennedy School, and Sage Park Middle School.
Ownership History
Date
Name
Owned For
Owner Type
Purchase Details
Closed on
Dec 10, 2002
Sold by
Ashraf Syed
Bought by
Havunen Richard
Current Estimated Value
Purchase Details
Closed on
Jun 28, 2000
Sold by
Zakrewski Edwin
Bought by
Ashraf Syed
Home Financials for this Owner
Home Financials are based on the most recent Mortgage that was taken out on this home.
Original Mortgage
$23,840
Interest Rate
11.38%
Mortgage Type
Purchase Money Mortgage
Purchase Details
Closed on
Jun 30, 1994
Sold by
Roth Julianne
Bought by
Zakrzewski Edwin and Deming Kathy
Home Financials for this Owner
Home Financials are based on the most recent Mortgage that was taken out on this home.
Original Mortgage
$44,400
Interest Rate
8.55%
Mortgage Type
Purchase Money Mortgage
Purchase Details
Closed on
Nov 26, 1991
Sold by
Roth Malcolm
Bought by
Roth Julieann
Home Financials for this Owner
Home Financials are based on the most recent Mortgage that was taken out on this home.
Original Mortgage
$50,000
Interest Rate
6.5%
Mortgage Type
Purchase Money Mortgage
Create a Home Valuation Report for This Property
The Home Valuation Report is an in-depth analysis detailing your home's value as well as a comparison with similar homes in the area
Home Values in the Area
Average Home Value in this Area
Purchase History
| Date | Buyer | Sale Price | Title Company |
|---|---|---|---|
| Havunen Richard | $35,000 | -- | |
| Ashraf Syed | $29,800 | -- | |
| Zakrzewski Edwin | $45,000 | -- | |
| Roth Julieann | $66,667 | -- |
Source: Public Records
Mortgage History
| Date | Status | Borrower | Loan Amount |
|---|---|---|---|
| Previous Owner | Roth Julieann | $23,840 | |
| Previous Owner | Roth Julieann | $44,400 | |
| Previous Owner | Roth Julieann | $50,000 |
Source: Public Records
Tax History
| Year | Tax Paid | Tax Assessment Tax Assessment Total Assessment is a certain percentage of the fair market value that is determined by local assessors to be the total taxable value of land and additions on the property. | Land | Improvement |
|---|---|---|---|---|
| 2025 | $1,866 | $65,590 | $0 | $65,590 |
| 2024 | $1,989 | $65,590 | $0 | $65,590 |
| 2023 | $1,442 | $42,910 | $0 | $42,910 |
| 2022 | $1,428 | $42,910 | $0 | $42,910 |
| 2021 | $1,428 | $42,910 | $0 | $42,910 |
| 2020 | $1,421 | $42,910 | $0 | $42,910 |
| 2019 | $1,389 | $42,910 | $0 | $42,910 |
| 2018 | $981 | $29,750 | $0 | $29,750 |
| 2017 | $956 | $29,470 | $0 | $29,470 |
| 2016 | $929 | $29,470 | $0 | $29,470 |
| 2015 | $911 | $29,470 | $0 | $29,470 |
| 2014 | $898 | $29,470 | $0 | $29,470 |
Source: Public Records
Map
Nearby Homes
- 943 High Path Rd Unit 943
- 268 High Path Rd Unit 268
- 136 High Path Rd
- 98 High Path Rd
- 118 High Path Rd Unit 118
- 58 High Path Rd Unit 58
- 485 River St
- 22 Apple Tree Ln
- 22 Eastview Dr
- 16 Cornfield Rd
- 211 MacKtown Rd
- 1 Deanne Lynn Cir
- 957 Palisado Ave
- 94 Raymond Rd
- 490 Old Day Hill Rd
- 24 Mary Catherine Cir
- 58 Hollow Brook Rd
- 109 Old Village Cir
- 1946 Poquonock Ave
- 1333 Palisado Ave
- 963 High Path Rd
- 963 High Path Rd Unit 963
- 941 High Path Rd
- 920 High Path Rd
- 919 High Path Rd
- 942 High Path Rd
- 962 High Path Rd
- 922 High Path Rd
- 964 High Path Rd
- 964 High Path Rd Unit 964
- 944 High Path Rd
- 958 High Path Rd
- 940 High Path Rd
- 940 High Path Rd Unit 940
- 966 High Path Rd
- 966 High Path Rd Unit 966
- 936 High Path Rd
- 936 High Path Rd Unit 936
- 921 High Path Rd
- 921 High Path Rd Unit 921
Your Personal Tour Guide
Ask me questions while you tour the home.