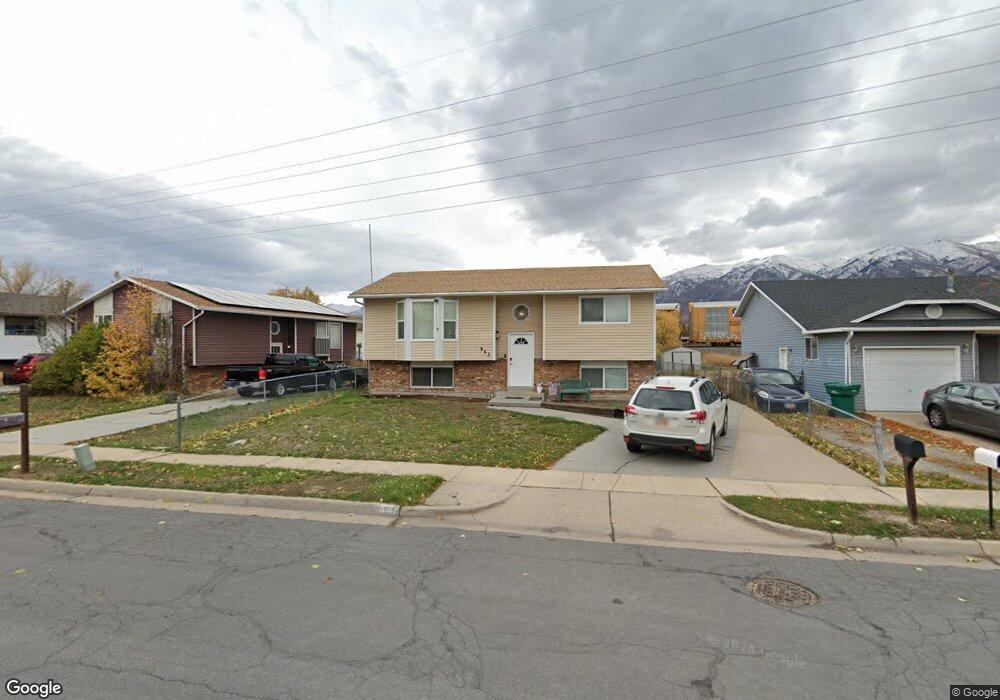
963 S 250 E Layton, UT 84041
Estimated Value: $406,806 - $432,000
3
Beds
2
Baths
932
Sq Ft
$445/Sq Ft
Est. Value
About This Home
This home is located at 963 S 250 E, Layton, UT 84041 and is currently estimated at $415,202, approximately $445 per square foot. 963 S 250 E is a home located in Davis County with nearby schools including Layton Elementary School, Fairfield Junior High School, and Davis High School.
Ownership History
Date
Name
Owned For
Owner Type
Purchase Details
Closed on
Sep 11, 2006
Sold by
Eccles Derek R
Bought by
Eccles Derek R and Eccles Lori A
Current Estimated Value
Home Financials for this Owner
Home Financials are based on the most recent Mortgage that was taken out on this home.
Original Mortgage
$28,800
Outstanding Balance
$17,102
Interest Rate
6.56%
Mortgage Type
Stand Alone Second
Estimated Equity
$398,100
Purchase Details
Closed on
Jun 27, 1996
Sold by
Coates Wanston V and Coates Lorie Michelle
Bought by
Eccles Derek R and Eccles Lori A
Home Financials for this Owner
Home Financials are based on the most recent Mortgage that was taken out on this home.
Original Mortgage
$101,329
Interest Rate
8.09%
Mortgage Type
FHA
Create a Home Valuation Report for This Property
The Home Valuation Report is an in-depth analysis detailing your home's value as well as a comparison with similar homes in the area
Home Values in the Area
Average Home Value in this Area
Purchase History
| Date | Buyer | Sale Price | Title Company |
|---|---|---|---|
| Eccles Derek R | -- | Backman Title Services | |
| Eccles Derek R | -- | Backman Title Services | |
| Eccles Derek R | -- | Bonneville Title Company Inc |
Source: Public Records
Mortgage History
| Date | Status | Borrower | Loan Amount |
|---|---|---|---|
| Open | Eccles Derek R | $28,800 | |
| Open | Eccles Derek R | $115,200 | |
| Closed | Eccles Derek R | $101,329 |
Source: Public Records
Tax History
| Year | Tax Paid | Tax Assessment Tax Assessment Total Assessment is a certain percentage of the fair market value that is determined by local assessors to be the total taxable value of land and additions on the property. | Land | Improvement |
|---|---|---|---|---|
| 2025 | $2,049 | $215,050 | $85,427 | $129,623 |
| 2024 | $1,919 | $202,950 | $96,262 | $106,688 |
| 2023 | $1,856 | $346,000 | $91,755 | $254,245 |
| 2022 | $1,978 | $200,200 | $59,744 | $140,456 |
| 2021 | $1,736 | $262,000 | $89,654 | $172,346 |
| 2020 | $1,561 | $226,000 | $74,745 | $151,255 |
| 2019 | $1,509 | $214,000 | $78,559 | $135,441 |
| 2018 | $1,384 | $197,000 | $58,388 | $138,612 |
| 2016 | $1,223 | $89,815 | $26,046 | $63,769 |
| 2015 | $1,190 | $82,995 | $26,046 | $56,949 |
| 2014 | $1,333 | $95,031 | $26,046 | $68,985 |
| 2013 | -- | $77,485 | $11,966 | $65,519 |
Source: Public Records
Map
Nearby Homes
- 948 S 250 E
- 949 S 225 E
- 282 E 925 S
- 464 E Alice Way
- 799 S 125 E
- 389 Morgan St
- 753 S 300 E
- 80 E 850 S
- 706 S 600 E
- 811 S Main St
- 617 E 405 S
- 623 E Clearwater Dr Unit 15
- 679 S Clearwater Falls Dr
- 905 S Main St Unit G
- 189 S Main St Unit 76
- 189 S Main St Unit 21
- 895 S Main St Unit E
- 917 S Main St Unit H
- 680 N Main St Trlr E-11
- 680 N Main St Unit B13
Your Personal Tour Guide
Ask me questions while you tour the home.