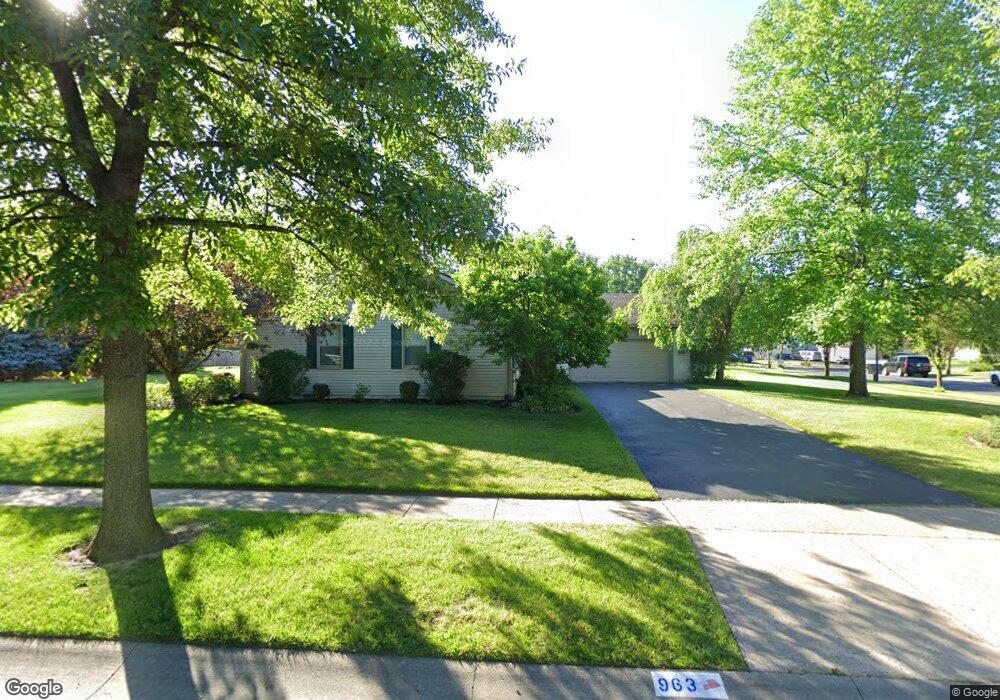
963 Trailwood Ct Toledo, OH 43615
Reynolds Corners NeighborhoodEstimated Value: $214,000 - $263,000
3
Beds
2
Baths
1,712
Sq Ft
$145/Sq Ft
Est. Value
About This Home
This home is located at 963 Trailwood Ct, Toledo, OH 43615 and is currently estimated at $247,496, approximately $144 per square foot. 963 Trailwood Ct is a home located in Lucas County with nearby schools including Reynolds Elementary School, Rogers High School, and Wildwood Environmental Academy.
Ownership History
Date
Name
Owned For
Owner Type
Purchase Details
Closed on
Aug 31, 2006
Sold by
Schaechterle Michael J and Schaechterle Christine M
Bought by
Olah Gerald L and Olah Carol L
Current Estimated Value
Home Financials for this Owner
Home Financials are based on the most recent Mortgage that was taken out on this home.
Original Mortgage
$40,000
Interest Rate
6.88%
Mortgage Type
Purchase Money Mortgage
Purchase Details
Closed on
Sep 29, 1999
Sold by
Donahue Christopher S
Bought by
Schaechterle Michael J and Schaechterle Christine M
Home Financials for this Owner
Home Financials are based on the most recent Mortgage that was taken out on this home.
Original Mortgage
$136,800
Outstanding Balance
$41,621
Interest Rate
7.93%
Estimated Equity
$205,875
Purchase Details
Closed on
Jan 18, 1994
Sold by
Donahue Christopher S
Purchase Details
Closed on
Feb 28, 1992
Purchase Details
Closed on
Aug 20, 1990
Create a Home Valuation Report for This Property
The Home Valuation Report is an in-depth analysis detailing your home's value as well as a comparison with similar homes in the area
Home Values in the Area
Average Home Value in this Area
Purchase History
| Date | Buyer | Sale Price | Title Company |
|---|---|---|---|
| Olah Gerald L | $169,600 | Louisville Title Agency For | |
| Schaechterle Michael J | $144,000 | -- | |
| -- | -- | -- | |
| -- | $22,500 | -- | |
| -- | -- | -- |
Source: Public Records
Mortgage History
| Date | Status | Borrower | Loan Amount |
|---|---|---|---|
| Closed | Olah Gerald L | $40,000 | |
| Open | Schaechterle Michael J | $136,800 |
Source: Public Records
Tax History Compared to Growth
Tax History
| Year | Tax Paid | Tax Assessment Tax Assessment Total Assessment is a certain percentage of the fair market value that is determined by local assessors to be the total taxable value of land and additions on the property. | Land | Improvement |
|---|---|---|---|---|
| 2024 | $1,670 | $59,535 | $12,880 | $46,655 |
| 2023 | $2,952 | $50,820 | $11,410 | $39,410 |
| 2022 | $2,956 | $50,820 | $11,410 | $39,410 |
| 2021 | $3,001 | $50,820 | $11,410 | $39,410 |
| 2020 | $3,279 | $49,385 | $8,330 | $41,055 |
| 2019 | $3,195 | $49,385 | $8,330 | $41,055 |
| 2018 | $3,195 | $49,385 | $8,330 | $41,055 |
| 2017 | $3,249 | $48,265 | $8,155 | $40,110 |
| 2016 | $3,265 | $137,900 | $23,300 | $114,600 |
| 2015 | $3,240 | $137,900 | $23,300 | $114,600 |
| 2014 | $2,461 | $47,890 | $8,160 | $39,730 |
| 2013 | $2,461 | $47,890 | $8,160 | $39,730 |
Source: Public Records
Map
Nearby Homes
- 5560 Greenridge Dr
- 1144 Bernath Pkwy Unit D
- 1055 Nela Pkwy
- 1051 Nela Pkwy
- 1187 Hidden Ridge Rd Unit A
- 5609 Willowood Ct Unit 5609
- 5222 Mardone Dr
- 5713 Tibaron Ln Unit 203
- 5150 Norton Place
- 715 S Holland Sylvania Rd
- 715 S Holland Sylvania Rd Unit 88
- 5708 Aspen Dr Unit 11
- 5035 Norwich Rd
- 5615 Baronswood Cir Unit 105
- 1533 Eaglebrook Rd
- 1240 Westgate Rd
- 1562 Saddlebrook Ct Unit B
- 1253 Eastgate Rd
- 4866 Airport Hwy
- 1415 Creekwood Ln
- 5540 Forest Green Dr
- 955 Trailwood Ct
- 5556 Forest Green Dr
- 5536 Forest Green Dr
- 5543 Forest Green Dr
- 945 Trailwood Ct
- 5537 Forest Green Dr
- 5547 Forest Green Dr
- 5560 Forest Green Dr
- 5532 Forest Green Dr
- 956 Trailwood Ct
- 5553 Forest Green Dr
- 5533 Forest Green Dr
- 948 Trailwood Ct
- 5564 Forest Green Dr
- 5557 Forest Green Dr
- 941 Trailwood Ct
- 5542 Greenridge Dr
- 5550 Greenridge Dr
- 1053 Forest Green Dr