Estimated Value: $662,108 - $734,000
Studio
4
Baths
3,585
Sq Ft
$195/Sq Ft
Est. Value
About This Home
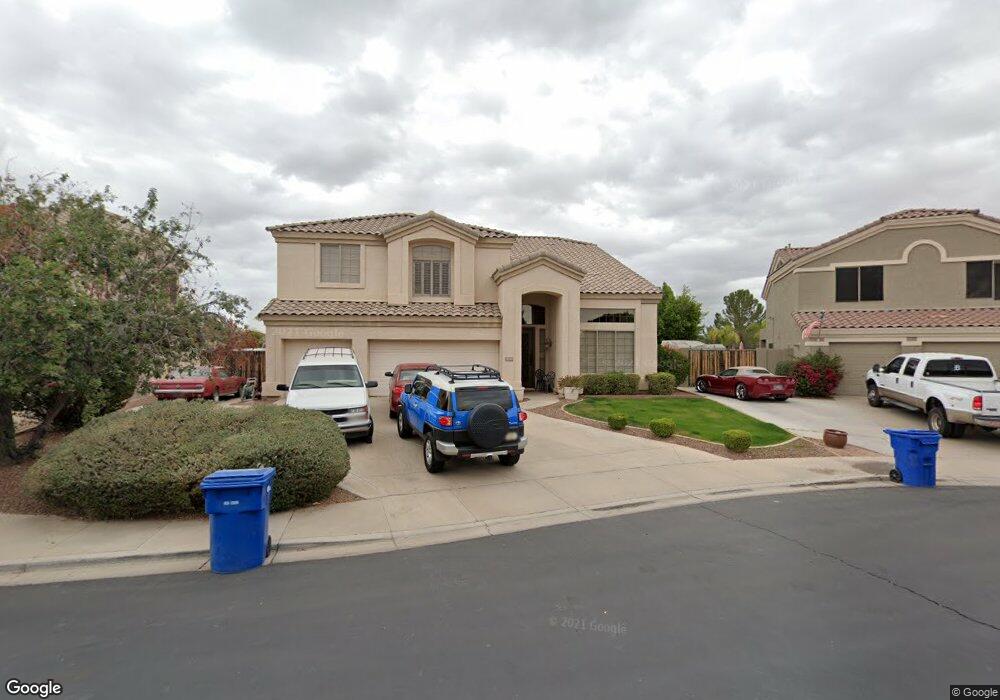
This home is located at 9630 E Lompoc Ave, Mesa, AZ 85209 and is currently estimated at $698,527, approximately $194 per square foot. 9630 E Lompoc Ave is a home located in Maricopa County with nearby schools including Augusta Ranch Elementary School, Desert Ridge Jr. High School, and Desert Ridge High School.
Ownership History
Date
Name
Owned For
Owner Type
Purchase Details
Closed on
Feb 20, 2015
Sold by
Purnell David
Bought by
The Purnell Family Living Trust and Purnell Kimberlee A
Current Estimated Value
Purchase Details
Closed on
Jan 27, 2003
Sold by
Purnell Kimberlee Rader
Bought by
Purnell David
Home Financials for this Owner
Home Financials are based on the most recent Mortgage that was taken out on this home.
Original Mortgage
$240,000
Outstanding Balance
$102,936
Interest Rate
5.97%
Estimated Equity
$595,591
Purchase Details
Closed on
Mar 26, 2001
Sold by
Purnell David W
Bought by
Purnell David and Purnell Kimberlee Rader
Home Financials for this Owner
Home Financials are based on the most recent Mortgage that was taken out on this home.
Original Mortgage
$220,000
Interest Rate
7.06%
Purchase Details
Closed on
Oct 12, 1999
Sold by
Purnell Kimberlee
Bought by
Purnell David W
Create a Home Valuation Report for This Property
The Home Valuation Report is an in-depth analysis detailing your home's value as well as a comparison with similar homes in the area
Purchase History
| Date | Buyer | Sale Price | Title Company |
|---|---|---|---|
| The Purnell Family Living Trust | -- | None Available | |
| Purnell David | -- | Lawyers Title Of Arizona Inc | |
| Purnell David | -- | Security Title Agency | |
| Purnell David W | -- | Stewart Title & Trust | |
| Purnell David W | $239,053 | Stewart Title & Trust |
Source: Public Records
Mortgage History
| Date | Status | Borrower | Loan Amount |
|---|---|---|---|
| Open | Purnell David | $240,000 | |
| Closed | Purnell David | $220,000 |
Source: Public Records
Tax History
| Year | Tax Paid | Tax Assessment Tax Assessment Total Assessment is a certain percentage of the fair market value that is determined by local assessors to be the total taxable value of land and additions on the property. | Land | Improvement |
|---|---|---|---|---|
| 2025 | $2,755 | $37,195 | -- | -- |
| 2024 | $2,673 | $35,424 | -- | -- |
| 2023 | $2,673 | $49,070 | $9,810 | $39,260 |
| 2022 | $2,608 | $38,050 | $7,610 | $30,440 |
| 2021 | $2,825 | $36,770 | $7,350 | $29,420 |
| 2020 | $2,776 | $34,360 | $6,870 | $27,490 |
| 2019 | $2,572 | $31,830 | $6,360 | $25,470 |
| 2018 | $2,449 | $30,970 | $6,190 | $24,780 |
| 2017 | $2,372 | $30,550 | $6,110 | $24,440 |
| 2016 | $2,448 | $30,050 | $6,010 | $24,040 |
| 2015 | $2,255 | $30,520 | $6,100 | $24,420 |
Source: Public Records
Map
Nearby Homes
- 9628 E Lindner Ave
- 9614 E Keats Ave
- 2024 S Baldwin Unit 125
- 2024 S Baldwin Unit 54
- 2024 S Baldwin Unit 64
- 2024 S Baldwin Unit 15
- 9631 E Lobo Ave
- 9722 E Lobo Ave
- 9728 E Kiva Ave
- 9831 E Lompoc Ave
- 2202 S Duval
- 9818 E Kiva Ave
- 2129 S Compton
- 9563 E Javelina Ave
- 9248 E Keats Ave
- 9236 E Medina Ave
- 1938 S Noble
- 2205 S Harper
- 2304 S Bernard
- 9316 E Monterey Ave
- 9622 E Lompoc Ave
- 9638 E Lompoc Ave
- 9614 E Lompoc Ave
- 2229 S Vincent
- 9629 E Lompoc Ave
- 9621 E Lompoc Ave
- 9606 E Lompoc Ave
- 2235 S Vincent
- 9613 E Lompoc Ave
- 2241 S Vincent
- 9602 E Lompoc Ave
- 9605 E Lompoc Ave
- 9628 E Los Lagos Vista Ave
- 9620 E Los Lagos Vista Ave
- 9612 E Los Lagos Vista Ave
- 2247 S Vincent
- 9565 E Lompoc Ave
- 9560 E Lompoc Ave
- 9604 E Los Lagos Vista Ave
- 9627 E Lindner Ave
Your Personal Tour Guide
Ask me questions while you tour the home.