9631 Capeview Ct Las Vegas, NV 89148
Estimated Value: $429,000 - $448,000
3
Beds
2
Baths
1,612
Sq Ft
$272/Sq Ft
Est. Value
About This Home
This home is located at 9631 Capeview Ct, Las Vegas, NV 89148 and is currently estimated at $438,307, approximately $271 per square foot. 9631 Capeview Ct is a home located in Clark County with nearby schools including Sandra B Abston Elementary School, Victoria Fertitta Middle School, and Durango High School.
Ownership History
Date
Name
Owned For
Owner Type
Purchase Details
Closed on
May 17, 2022
Sold by
Deborah D Grigas Separate Property Trust
Bought by
Lee June Hee Won
Current Estimated Value
Purchase Details
Closed on
Jul 14, 2014
Sold by
Grigas Deborah D
Bought by
Grigas Deborah D and The Deborah D Grigas Separate Property T
Purchase Details
Closed on
Sep 19, 2006
Sold by
Bailey Kathy M
Bought by
Grigas Deborah D
Home Financials for this Owner
Home Financials are based on the most recent Mortgage that was taken out on this home.
Original Mortgage
$130,000
Interest Rate
5.95%
Mortgage Type
Unknown
Purchase Details
Closed on
Sep 11, 2002
Sold by
Pinnacle Aurora Iv Ltd Partnership
Bought by
Bailey Kathy M
Home Financials for this Owner
Home Financials are based on the most recent Mortgage that was taken out on this home.
Original Mortgage
$139,250
Interest Rate
6.37%
Create a Home Valuation Report for This Property
The Home Valuation Report is an in-depth analysis detailing your home's value as well as a comparison with similar homes in the area
Home Values in the Area
Average Home Value in this Area
Purchase History
| Date | Buyer | Sale Price | Title Company |
|---|---|---|---|
| Lee June Hee Won | $435,000 | Equity Title | |
| Grigas Deborah D | -- | None Available | |
| Grigas Deborah D | $330,000 | Stewart Title Of Nevada | |
| Bailey Kathy M | $182,688 | Nevada Title Company |
Source: Public Records
Mortgage History
| Date | Status | Borrower | Loan Amount |
|---|---|---|---|
| Previous Owner | Grigas Deborah D | $130,000 | |
| Previous Owner | Bailey Kathy M | $139,250 |
Source: Public Records
Tax History Compared to Growth
Tax History
| Year | Tax Paid | Tax Assessment Tax Assessment Total Assessment is a certain percentage of the fair market value that is determined by local assessors to be the total taxable value of land and additions on the property. | Land | Improvement |
|---|---|---|---|---|
| 2025 | $1,740 | $109,009 | $35,700 | $73,309 |
| 2024 | $1,692 | $109,009 | $35,700 | $73,309 |
| 2023 | $1,692 | $98,065 | $31,500 | $66,565 |
| 2022 | $1,717 | $88,717 | $25,550 | $63,167 |
| 2021 | $1,590 | $75,734 | $24,150 | $51,584 |
| 2020 | $1,540 | $76,209 | $22,400 | $53,809 |
| 2019 | $1,496 | $72,623 | $19,250 | $53,373 |
| 2018 | $1,452 | $67,711 | $16,450 | $51,261 |
| 2017 | $1,914 | $64,929 | $14,000 | $50,929 |
| 2016 | $1,376 | $62,151 | $10,500 | $51,651 |
| 2015 | $1,517 | $53,999 | $9,450 | $44,549 |
| 2014 | $1,332 | $43,758 | $8,400 | $35,358 |
Source: Public Records
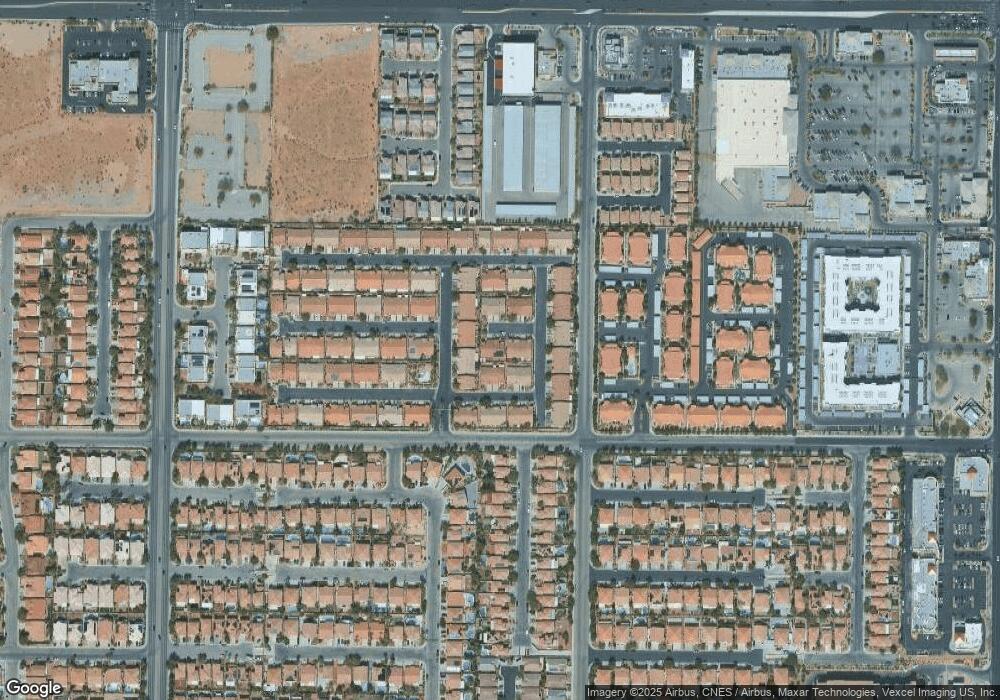
Map
Nearby Homes
- 5048 Orchid Springs St
- 9693 Bighorn Island Ave
- 5014 Thunder River Cir
- 5076 Thunder River Cir
- 9580 W Reno Ave Unit 261
- 9580 W Reno Ave Unit 240
- 9580 W Reno Ave Unit 233
- 9580 W Reno Ave Unit 238
- 5077 Thunder River Cir
- 5015 Thunder River Cir
- 9731 Cathedral Stairs Ct
- 9821 Sedona Shrine Ave
- 9699 Villa Lorena Ave
- 9522 Arrowhead Falls Ct
- 9748 Villa Lorena Ave
- 9794 Villa Lorena Ave
- 9685 Midnight Sun Ave
- 9631 Tuscola Ct
- 9647 Emeraude Ave
- 9687 Ridgebluff Ave
- 9623 Capeview Ct
- 9639 Capeview Ct
- 9630 Donner Springs Ave
- 9622 Donner Springs Ave Unit 2
- 9638 Donner Springs Ave
- 9646 Donner Springs Ave Unit 2
- 9632 Capeview Ct Unit n/a
- 9640 Capeview Ct Unit 2
- 9624 Capeview Ct
- 5066 Shadow River St Unit 2
- 5054 Orchid Springs St
- 9648 Capeview Ct
- 5060 Orchid Springs St
- 5060 Shadow River St
- 5072 Shadow River St Unit 2
- 5066 Orchid Springs St
- 5054 Shadow River St
- 5042 Orchid Springs St
- 5072 Orchid Springs St