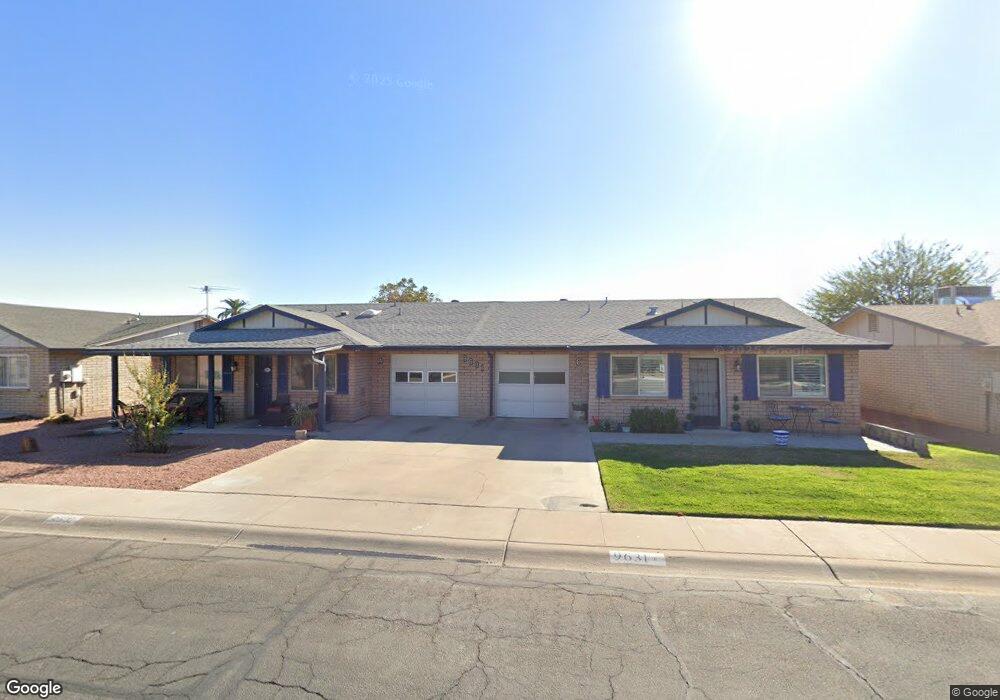
9631 W Brown St Unit B Peoria, AZ 85345
Estimated Value: $199,747 - $234,000
--
Bed
2
Baths
1,072
Sq Ft
$205/Sq Ft
Est. Value
About This Home
This home is located at 9631 W Brown St Unit B, Peoria, AZ 85345 and is currently estimated at $219,937, approximately $205 per square foot. 9631 W Brown St Unit B is a home located in Maricopa County with nearby schools including Sun Valley Elementary School, Raymond S. Kellis, and Ombudsman - Northwest Charter.
Ownership History
Date
Name
Owned For
Owner Type
Purchase Details
Closed on
Jul 12, 2023
Sold by
Andrews Terry Ann
Bought by
Terry Ann Andrews Revocable Trust and Andrews
Current Estimated Value
Purchase Details
Closed on
Nov 19, 2018
Sold by
Hagon Barbara L
Bought by
Andrews Terry Ann
Home Financials for this Owner
Home Financials are based on the most recent Mortgage that was taken out on this home.
Original Mortgage
$85,600
Interest Rate
4.9%
Mortgage Type
New Conventional
Purchase Details
Closed on
Mar 11, 2011
Sold by
Hagon John P and Hagon Darlene T
Bought by
Hagon Michael T and Hagon Barbara L
Purchase Details
Closed on
Jul 10, 2000
Sold by
Hagon John P
Bought by
Hagon John P and Hagon Darlene T
Purchase Details
Closed on
Jun 28, 2000
Sold by
Hagon Michael T
Bought by
Hagon Michael T and Hagon Barbara L
Create a Home Valuation Report for This Property
The Home Valuation Report is an in-depth analysis detailing your home's value as well as a comparison with similar homes in the area
Home Values in the Area
Average Home Value in this Area
Purchase History
| Date | Buyer | Sale Price | Title Company |
|---|---|---|---|
| Terry Ann Andrews Revocable Trust | -- | None Listed On Document | |
| Andrews Terry Ann | $107,000 | Driggs Title Agency Inc | |
| Hagon Michael T | -- | None Available | |
| Hagon John P | -- | -- | |
| Hagon Michael T | -- | -- |
Source: Public Records
Mortgage History
| Date | Status | Borrower | Loan Amount |
|---|---|---|---|
| Previous Owner | Andrews Terry Ann | $85,600 |
Source: Public Records
Tax History Compared to Growth
Tax History
| Year | Tax Paid | Tax Assessment Tax Assessment Total Assessment is a certain percentage of the fair market value that is determined by local assessors to be the total taxable value of land and additions on the property. | Land | Improvement |
|---|---|---|---|---|
| 2025 | $476 | $6,114 | -- | -- |
| 2024 | $469 | $5,823 | -- | -- |
| 2023 | $469 | $16,510 | $3,300 | $13,210 |
| 2022 | $459 | $12,950 | $2,590 | $10,360 |
| 2021 | $491 | $11,260 | $2,250 | $9,010 |
| 2020 | $496 | $10,420 | $2,080 | $8,340 |
| 2019 | $480 | $9,110 | $1,820 | $7,290 |
| 2018 | $545 | $7,330 | $1,460 | $5,870 |
| 2017 | $543 | $6,120 | $1,220 | $4,900 |
| 2016 | $537 | $5,470 | $1,090 | $4,380 |
| 2015 | $500 | $5,560 | $1,110 | $4,450 |
Source: Public Records
Map
Nearby Homes
- 10134 N 97th Ave Unit B
- 10127 N 95th Dr Unit A
- 9616 W Mountain View Rd Unit A
- 10018 N 97th Dr Unit A
- 9564 W Purdue Ave
- 9653 W Purdue Ave
- 10226 N 93rd Dr
- 9627 W North Ln Unit B
- 10245 N 93rd Dr
- 9717 W Purdue Ave
- 10201 N 99th Ave Unit 32A
- 10201 N 99th Ave Unit 46
- 10201 N 99th Ave Unit 44
- 10201 N 99th Ave Unit 97
- 10201 N 99th Ave Unit 34
- 10201 N 99th Ave Unit 28A
- 10201 N 99th Ave Unit 49
- 10201 N 99th Ave Unit 129E
- 10201 N 99th Ave Unit 135F
- 10201 N 99th Ave Unit 3
- 9631 W Brown St Unit A
- 9623 W Brown St Unit B
- 9623 W Brown St Unit A
- 9639 W Brown St Unit B
- 9639 W Brown St Unit A
- 9639 W Brown St
- 9630 W Cinnabar Ave Unit A
- 9630 W Cinnabar Ave Unit B
- 9622 W Cinnabar Ave Unit A
- 9638 W Cinnabar Ave Unit B
- 9638 W Cinnabar Ave Unit A
- 9615 W Brown St Unit A
- 9615 W Brown St Unit B
- 9645 W Brown St Unit B
- 9645 W Brown St Unit A
- 10104 N 96th Dr Unit B
- 10104 N 96th Dr Unit A
- 9646 W Cinnabar Ave Unit B
- 9646 W Cinnabar Ave Unit A
- 9614 W Cinnabar Ave Unit A