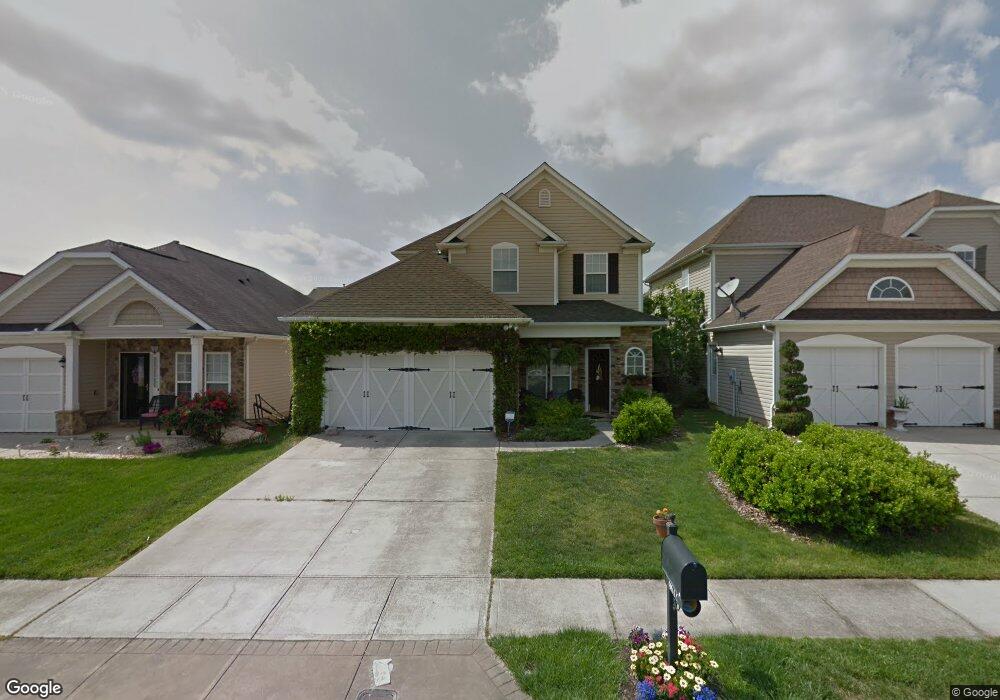
9632 Storybook Ave NW Concord, NC 28027
Estimated Value: $350,000 - $367,878
3
Beds
3
Baths
1,400
Sq Ft
$258/Sq Ft
Est. Value
About This Home
This home is located at 9632 Storybook Ave NW, Concord, NC 28027 and is currently estimated at $361,720, approximately $258 per square foot. 9632 Storybook Ave NW is a home located in Cabarrus County with nearby schools including W.R. Odell Elementary School, Harris Road Middle, and Cox Mill High School.
Ownership History
Date
Name
Owned For
Owner Type
Purchase Details
Closed on
May 21, 2017
Sold by
Rogers Hannah and Rogers Benjamin
Bought by
Rogers Hannah and Rogers Benjamin
Current Estimated Value
Home Financials for this Owner
Home Financials are based on the most recent Mortgage that was taken out on this home.
Original Mortgage
$169,666
Outstanding Balance
$141,675
Interest Rate
4.25%
Mortgage Type
FHA
Estimated Equity
$220,045
Purchase Details
Closed on
Dec 17, 2004
Sold by
North Carolina Partners Inc
Bought by
Smith Hannah L
Home Financials for this Owner
Home Financials are based on the most recent Mortgage that was taken out on this home.
Original Mortgage
$159,098
Interest Rate
5.67%
Mortgage Type
FHA
Purchase Details
Closed on
Aug 26, 2004
Sold by
J & B Development & Management Inc
Bought by
North Carolina Partners Inc
Purchase Details
Closed on
Aug 25, 2004
Sold by
Rj Moss Farms
Bought by
J & B Development & Management Inc
Create a Home Valuation Report for This Property
The Home Valuation Report is an in-depth analysis detailing your home's value as well as a comparison with similar homes in the area
Home Values in the Area
Average Home Value in this Area
Purchase History
| Date | Buyer | Sale Price | Title Company |
|---|---|---|---|
| Rogers Hannah | -- | None Available | |
| Smith Hannah L | $160,500 | -- | |
| North Carolina Partners Inc | $86,000 | -- | |
| J & B Development & Management Inc | $5,000 | -- |
Source: Public Records
Mortgage History
| Date | Status | Borrower | Loan Amount |
|---|---|---|---|
| Open | Rogers Hannah | $169,666 | |
| Closed | Smith Hannah L | $159,098 |
Source: Public Records
Tax History Compared to Growth
Tax History
| Year | Tax Paid | Tax Assessment Tax Assessment Total Assessment is a certain percentage of the fair market value that is determined by local assessors to be the total taxable value of land and additions on the property. | Land | Improvement |
|---|---|---|---|---|
| 2025 | $3,632 | $364,670 | $82,000 | $282,670 |
| 2024 | $3,632 | $364,670 | $82,000 | $282,670 |
| 2023 | $2,639 | $222,560 | $49,000 | $173,560 |
| 2022 | $2,639 | $216,310 | $49,000 | $167,310 |
| 2021 | $2,639 | $216,310 | $49,000 | $167,310 |
| 2020 | $2,639 | $216,310 | $49,000 | $167,310 |
| 2019 | $1,981 | $162,360 | $35,000 | $127,360 |
| 2018 | $1,948 | $162,360 | $35,000 | $127,360 |
| 2017 | $1,916 | $162,360 | $35,000 | $127,360 |
| 2016 | $1,137 | $156,810 | $35,000 | $121,810 |
| 2015 | $1,850 | $156,810 | $35,000 | $121,810 |
| 2014 | $1,850 | $156,810 | $35,000 | $121,810 |
Source: Public Records
Map
Nearby Homes
- 1423 Napa St NW
- 9611 Marquette St NW
- 1418 Skidaway St NW Unit 427
- 1498 Burrell Ave NW
- 1484 Haverford Rd NW
- 9593 Valencia Ave NW
- 9768 Walkers Glen Dr NW
- 9803 Walkers Glen Dr NW
- 1559 Broderick St NW
- 1266 Amber Ridge Rd NW
- 9711 Marquette St NW
- 9608 Indian Beech Ave NW
- 9720 Walkers Glen Dr NW
- 9691 Moss Plantation Ave NW
- 9562 Indian Beech Ave NW Unit 291
- 9610 Walkers Glen Dr NW
- 1576 Bay Meadows Ave NW
- 9430 Pepperidge Ave NW
- 1595 Bay Meadows Ave NW
- 1656 Respect St NW
- 9628 Storybook Ave NW
- 9636 Storybook Ave NW
- 9640 Storybook Ave NW
- 9624 Storybook Ave NW
- 1419 Napa St NW
- 9635 Widespread Ave NW
- 9644 Storybook Ave NW
- 1391 Napa St NW
- 9639 Widespread Ave NW
- 9635 Storybook Ave NW
- 9645 Widespread Ave NW
- 9639 Storybook Ave NW
- 9648 Storybook Ave NW
- 1381 Napa St NW
- 9641 Storybook Ave NW
- 9651 Widespread Ave NW
- 9645 Storybook Ave NW
- 1410 Napa St NW
- 9652 Storybook Ave NW
- 1406 Napa St NW