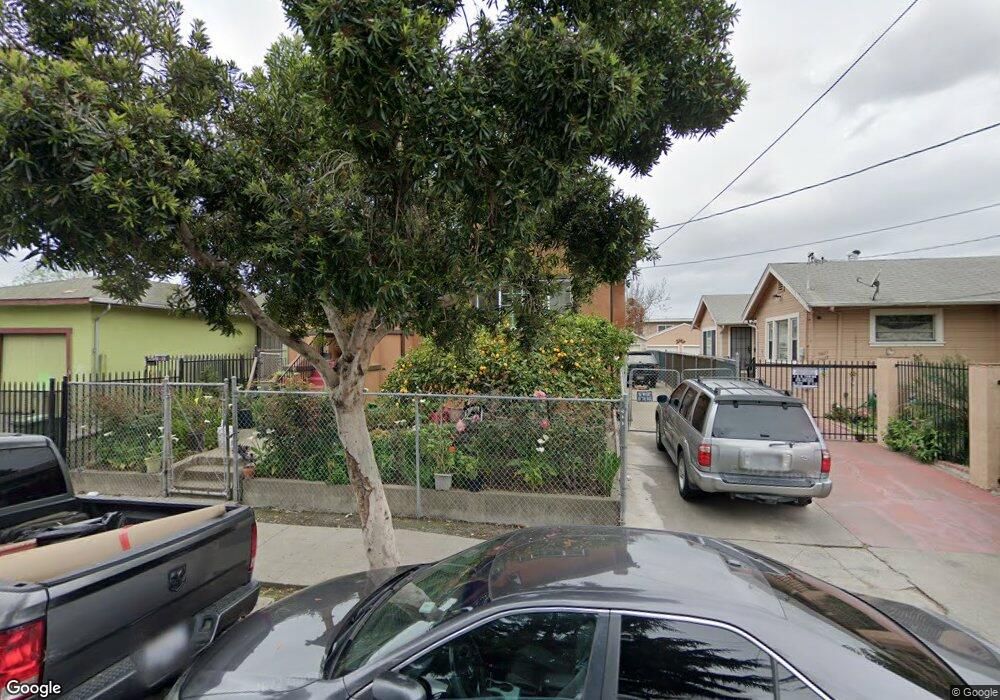
9633 D St Oakland, CA 94603
Elmhurst Park NeighborhoodEstimated Value: $402,000 - $504,000
2
Beds
1
Bath
1,068
Sq Ft
$411/Sq Ft
Est. Value
About This Home
This home is located at 9633 D St, Oakland, CA 94603 and is currently estimated at $439,215, approximately $411 per square foot. 9633 D St is a home located in Alameda County with nearby schools including Fred T. Korematsu Discovery Academy, Esperanza Elementary School, and Elmhurst United Middle School.
Ownership History
Date
Name
Owned For
Owner Type
Purchase Details
Closed on
May 19, 2009
Sold by
Valencia Maria
Bought by
Valencia Daniel
Current Estimated Value
Home Financials for this Owner
Home Financials are based on the most recent Mortgage that was taken out on this home.
Original Mortgage
$140,160
Outstanding Balance
$88,318
Interest Rate
4.8%
Mortgage Type
FHA
Estimated Equity
$350,897
Purchase Details
Closed on
Oct 22, 2007
Sold by
Ferguson Vergie Lee
Bought by
The Vergie L Ferguson Living Trust
Create a Home Valuation Report for This Property
The Home Valuation Report is an in-depth analysis detailing your home's value as well as a comparison with similar homes in the area
Home Values in the Area
Average Home Value in this Area
Purchase History
| Date | Buyer | Sale Price | Title Company |
|---|---|---|---|
| Valencia Daniel | -- | Old Republic Title Company | |
| Valencia Daniel | $145,000 | Old Republic Title Company | |
| The Vergie L Ferguson Living Trust | -- | None Available |
Source: Public Records
Mortgage History
| Date | Status | Borrower | Loan Amount |
|---|---|---|---|
| Open | Valencia Daniel | $140,160 |
Source: Public Records
Tax History
| Year | Tax Paid | Tax Assessment Tax Assessment Total Assessment is a certain percentage of the fair market value that is determined by local assessors to be the total taxable value of land and additions on the property. | Land | Improvement |
|---|---|---|---|---|
| 2025 | $4,067 | $179,711 | $56,013 | $130,698 |
| 2024 | $4,067 | $176,051 | $54,915 | $128,136 |
| 2023 | $4,164 | $179,463 | $53,839 | $125,624 |
| 2022 | $3,994 | $168,945 | $52,783 | $123,162 |
| 2021 | $3,690 | $165,495 | $51,748 | $120,747 |
| 2020 | $3,647 | $170,728 | $51,218 | $119,510 |
| 2019 | $3,428 | $167,381 | $50,214 | $117,167 |
| 2018 | $3,359 | $164,100 | $49,230 | $114,870 |
| 2017 | $3,200 | $160,882 | $48,264 | $112,618 |
| 2016 | $3,016 | $157,728 | $47,318 | $110,410 |
| 2015 | $2,996 | $155,361 | $46,608 | $108,753 |
| 2014 | $2,935 | $152,318 | $45,695 | $106,623 |
Source: Public Records
Map
Nearby Homes
Your Personal Tour Guide
Ask me questions while you tour the home.